- About
- Basic Features
- Introduction
- Platform Tenant Management
- Platform User Management
- TOTP Certification
- Basic Data Definition
- Media Management
- Command Management
- Mail Server Configuration
- Job Center
- Platform Host Resource Pool
- Platform Database Pool
- Platform Proxy Nodes Management
- Platform Components Management
- Additional Information Management
- Operation Log
- Connection Concurrency Configuration
- Customization of Platform Styles
- Parameter Templates
- License
- Monitor Large Screen
- Overview Display
- Tenant User Management
- Tenant Host Resource Pool
- Tenant Proxy Nodes Management
- Menu Management
- Report Center
- MogDB/openGauss
- Backup Recovery Center
- Monitoring
- Alert Center
- Inspect Center
Transaction Lock Analysis
Function Entrance
MogDB/openGauss --> Performance Monitoring --> Instance --> Transaction Lock Analysis

Function Description
Transaction lock analysis: Analysis of long and large transactions.
Operating Instructions
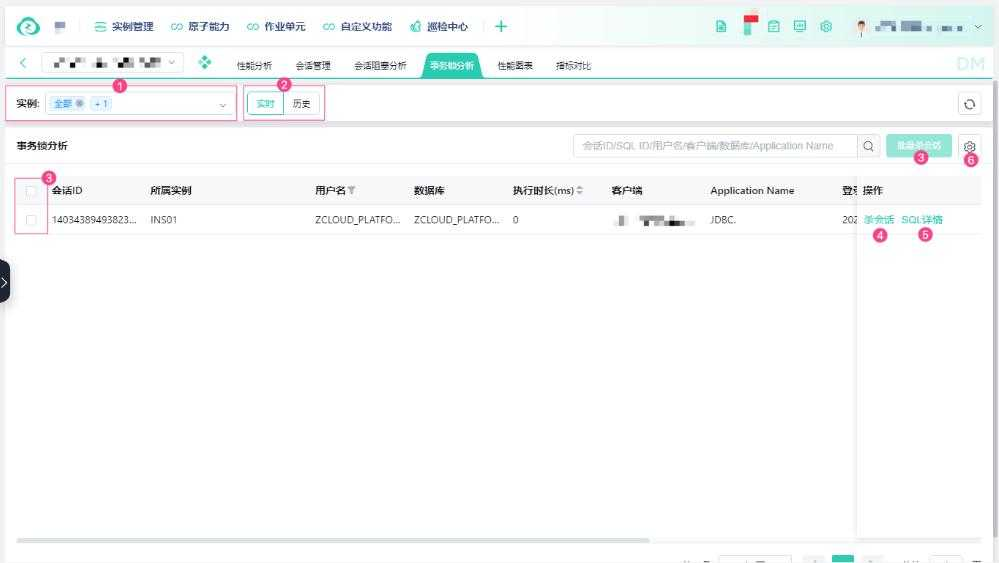
Transaction Lock Analysis (Real-time)
① Instance selection box: Select the instances that require transaction lock analysis, supporting multi-selection;
② Switch between real-time and historical pages for transaction lock analysis by clicking the History button to switch to the long and large transaction list;
③ After selecting multiple sessions, the Batch Kill Sessions button becomes active. Click the Batch Kill Sessions button to display the confirmation popup, and click Confirm to terminate the selected sessions;
④ In the list operation area, click the Kill Session button to individually terminate a session;
⑤ In the list operation area, click the SQL Details button, and a new browser tab will open and redirect to the SQL details page;
⑥ Click the gear icon button to display the custom list item popup, where you can configure the default display of field columns in the list.
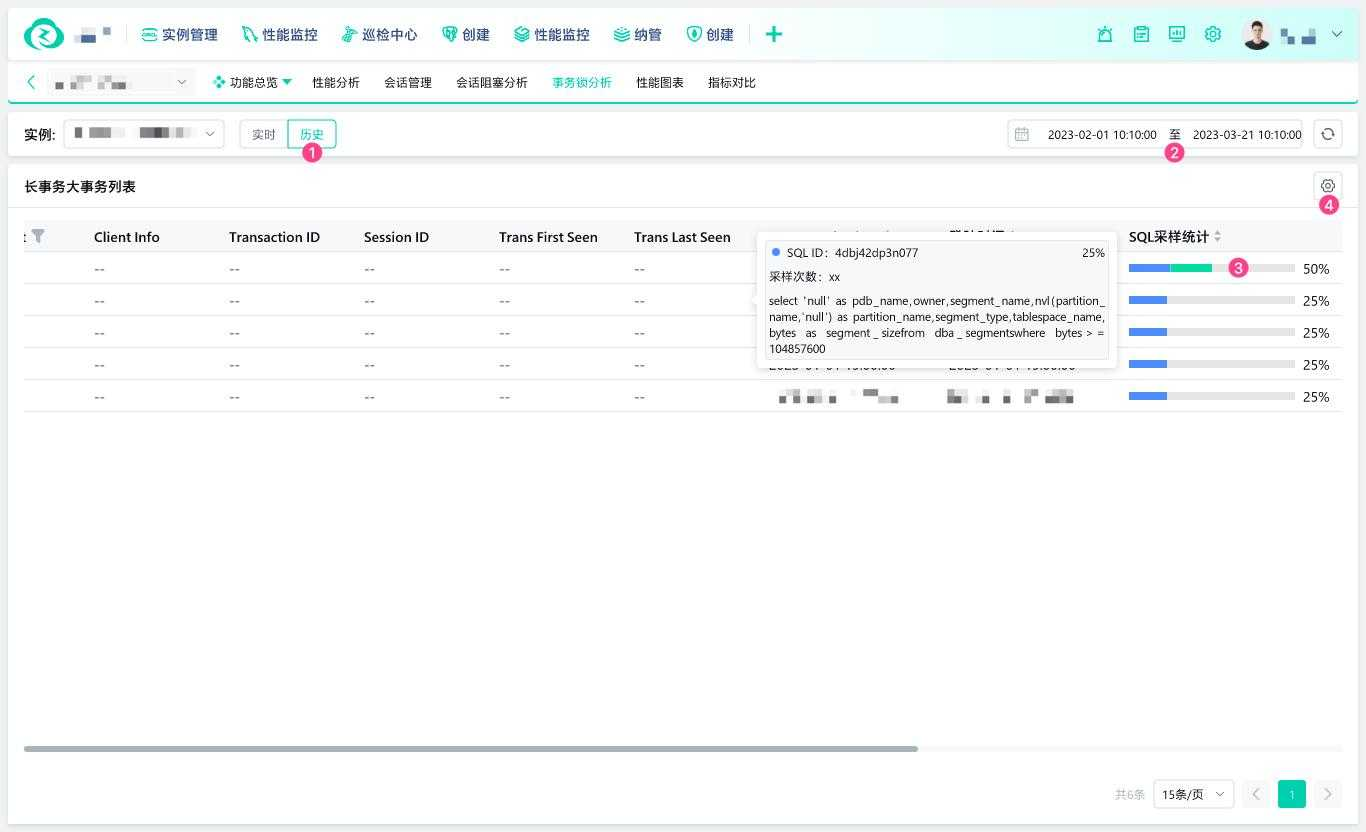
Long and Large Transaction List (Historical)
① Click the History tab button to switch to the long and large transaction list;
② Time selection: Choose the historical time range for long and large transactions that you want to view;
③ SQL sampling statistics: You can view the SQL sampling ratio. Hover the mouse over the SQL sampling statistics bar to display SQL ID, sampling times, SQL text, and other information. Multiple SQL samples will display multiple SQL information;