- About
- Basic Features
- Introduction
- Platform Tenant Management
- Platform User Management
- TOTP Certification
- Basic Data Definition
- Media Management
- Command Management
- Mail Server Configuration
- Job Center
- Platform Host Resource Pool
- Platform Database Pool
- Platform Proxy Nodes Management
- Platform Components Management
- Additional Information Management
- Operation Log
- Connection Concurrency Configuration
- Customization of Platform Styles
- Parameter Templates
- License
- Monitor Large Screen
- Overview Display
- Tenant User Management
- Tenant Host Resource Pool
- Tenant Proxy Nodes Management
- Menu Management
- Report Center
- MogDB/openGauss
- Backup Recovery Center
- Monitoring
- Alert Center
- Inspect Center
Performance Charts
Function Entrance
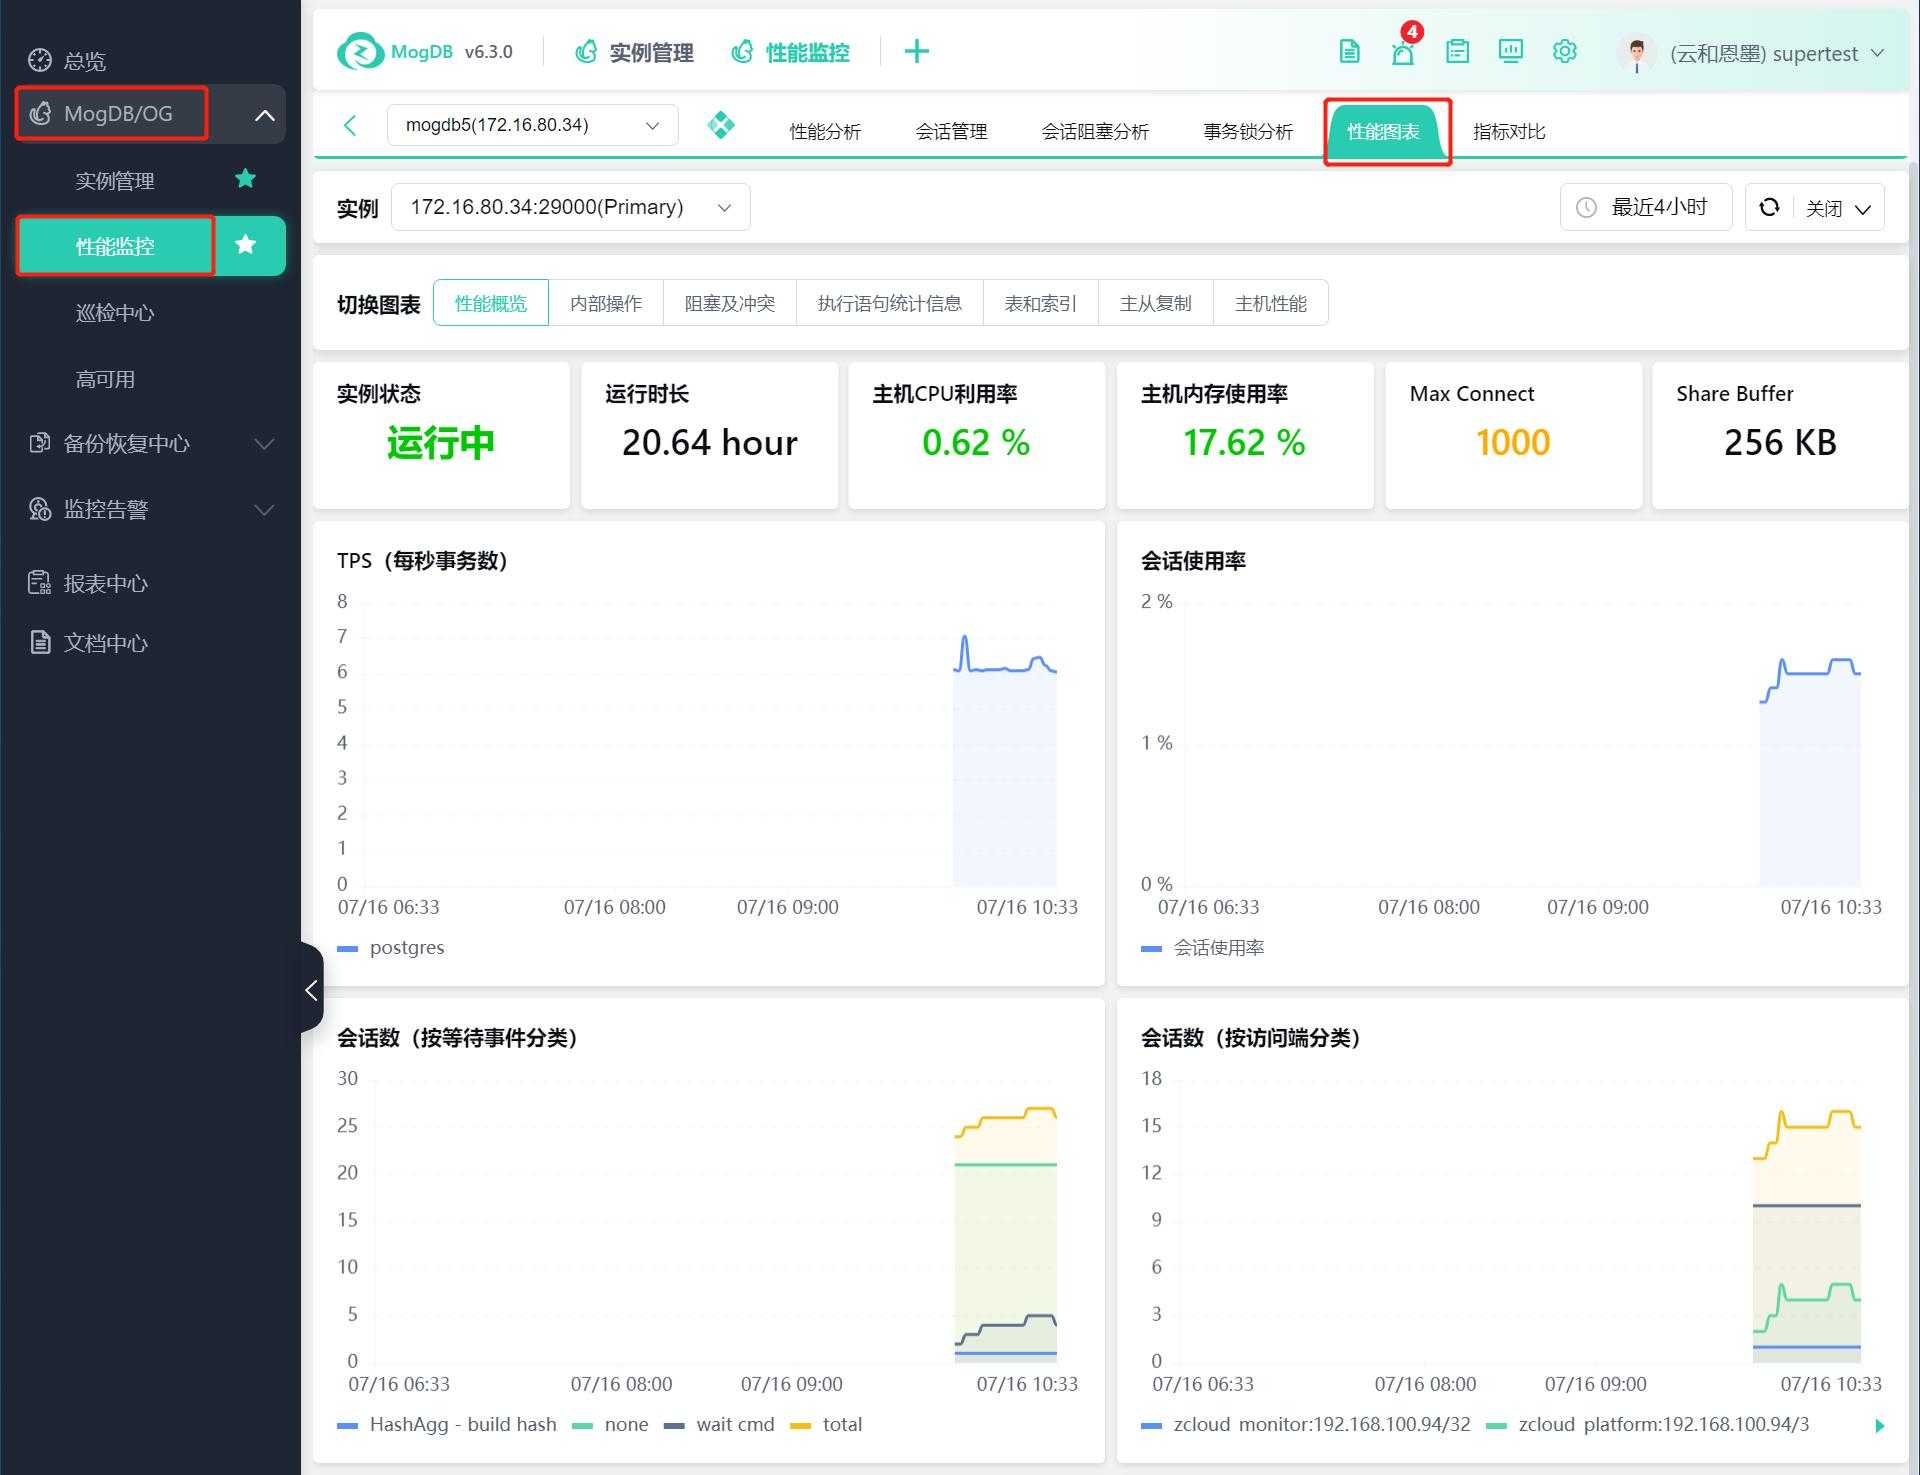
Left-hand function bar MogDB/openGauss --> Performance Monitoring --> Select MogDB/openGauss instance --> Performance Charts
Function Description
Display key performance metric information such as MogDB/openGauss database status, connection count, TPS, host CPU usage, and host memory usage. The charts displayed can be customized through the "Dashboard Management" function for monitoring charts. See Customize Dashboard.
Operating Instructions
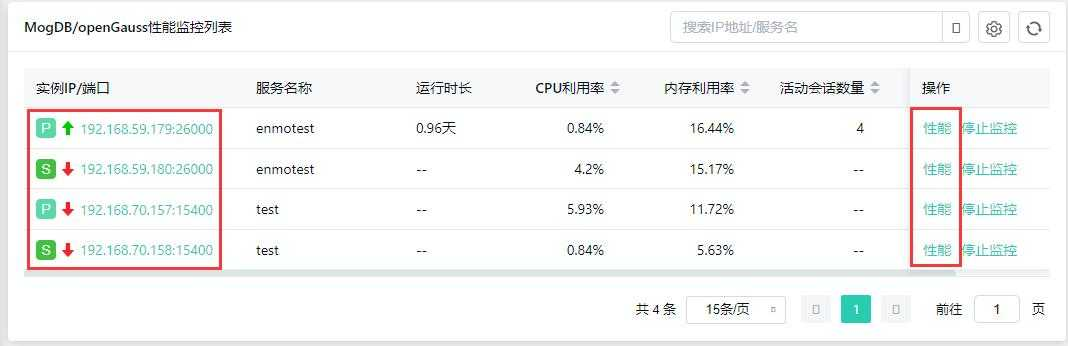
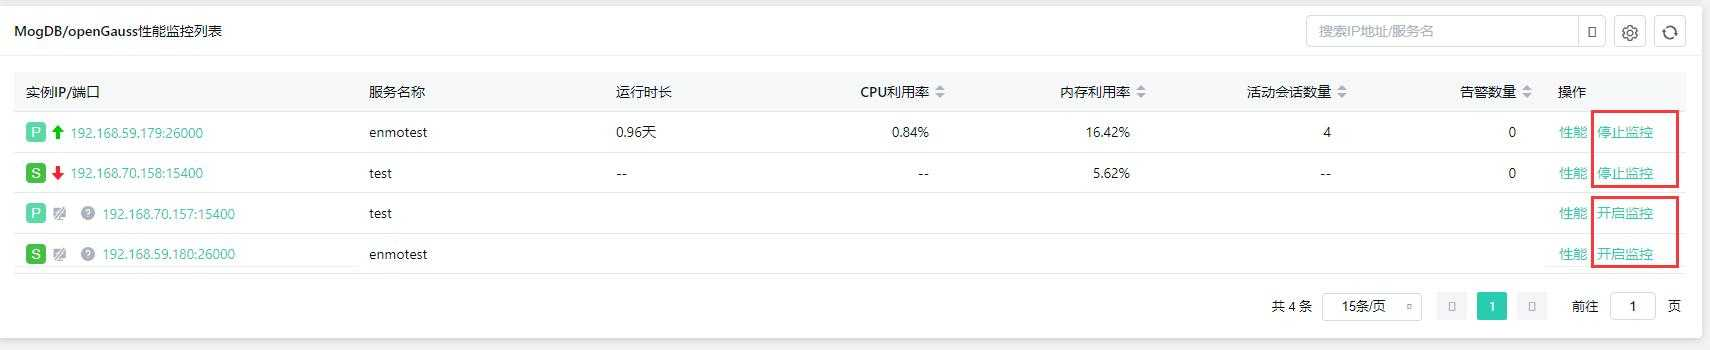
Click on the instance IP or performance to enter the performance chart interface
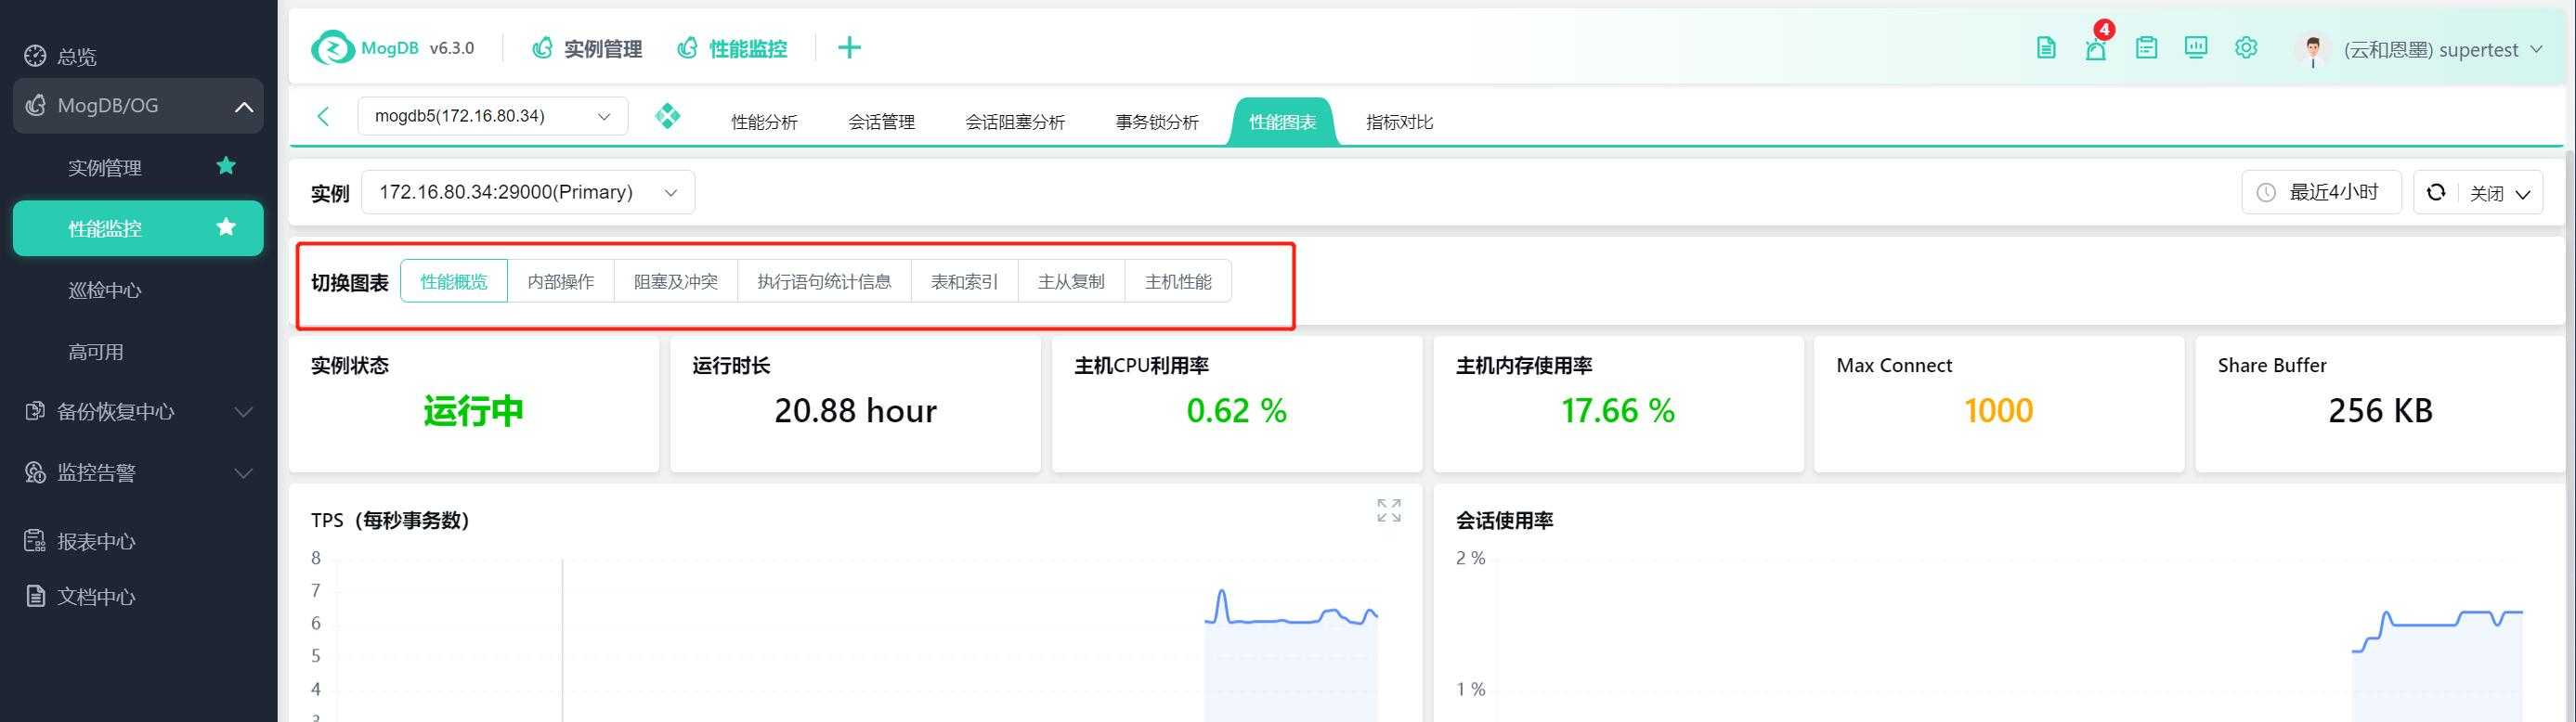
Click "Switch Chart" to switch between performance overview, internal operations, blocking and conflicts, execution statement statistics, tables and indexes, master-slave replication, and host performance.
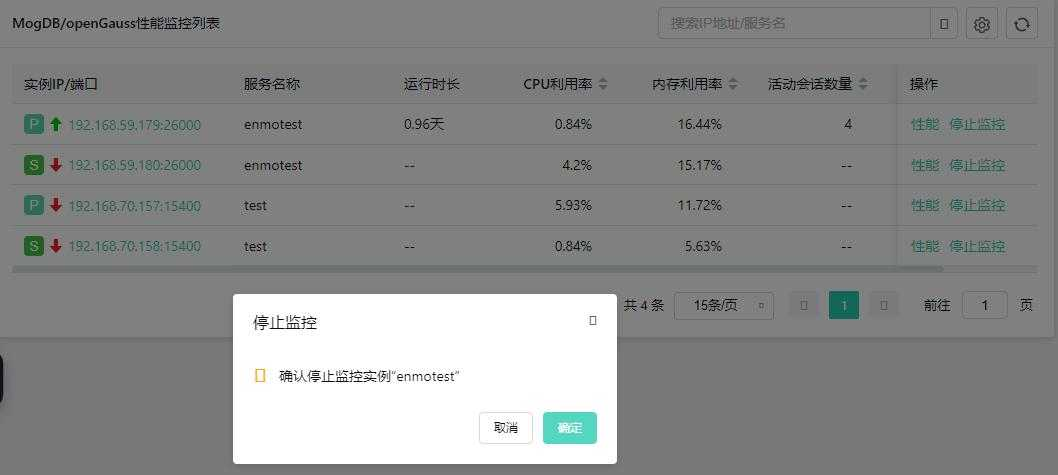
Stop/Start Monitoring
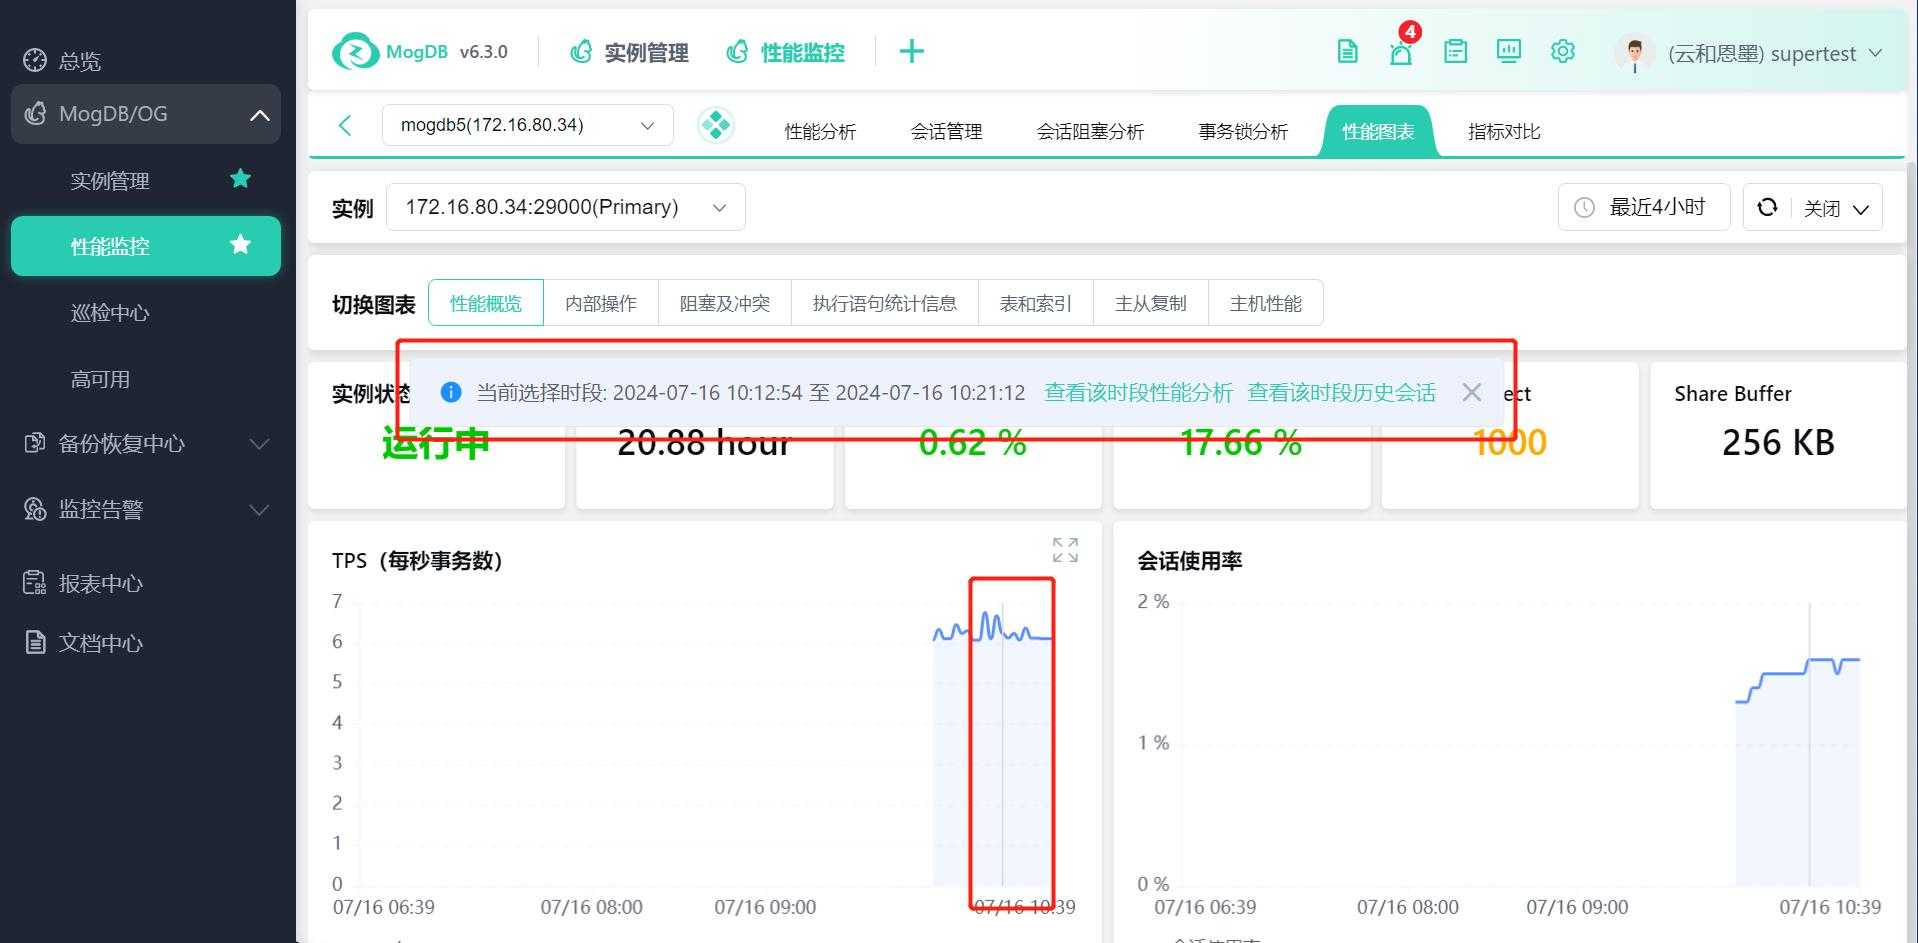
When fluctuations are detected, you can select a time segment and jump to the corresponding performance analysis tab to analyze the issue.