- About
- Basic Features
- Introduction
- Platform Tenant Management
- Platform User Management
- TOTP Certification
- Basic Data Definition
- Media Management
- Command Management
- Mail Server Configuration
- Job Center
- Platform Host Resource Pool
- Platform Database Pool
- Platform Proxy Nodes Management
- Platform Components Management
- Additional Information Management
- Operation Log
- Connection Concurrency Configuration
- Customization of Platform Styles
- Parameter Templates
- License
- Monitor Large Screen
- Overview Display
- Tenant User Management
- Tenant Host Resource Pool
- Tenant Proxy Nodes Management
- Menu Management
- Report Center
- MogDB/openGauss
- Backup Recovery Center
- Monitoring
- Alert Center
- Inspect Center
Performance Analysis
Function Entrance
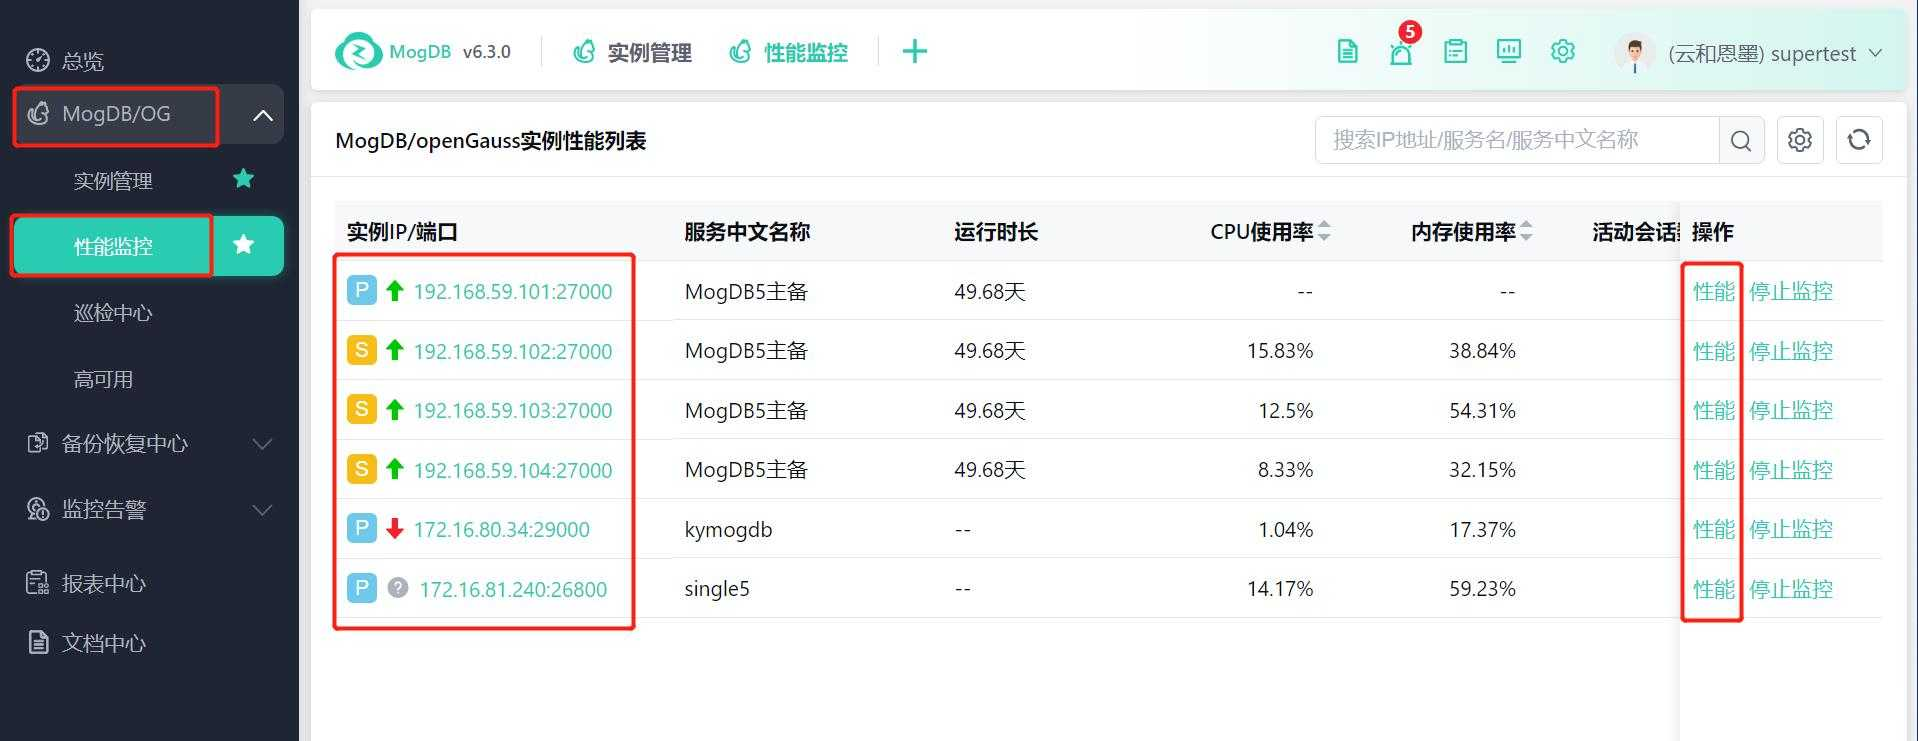
Entrance 1: MogDB/openGauss --> Performance Monitoring --> Click on the instance name/performance button
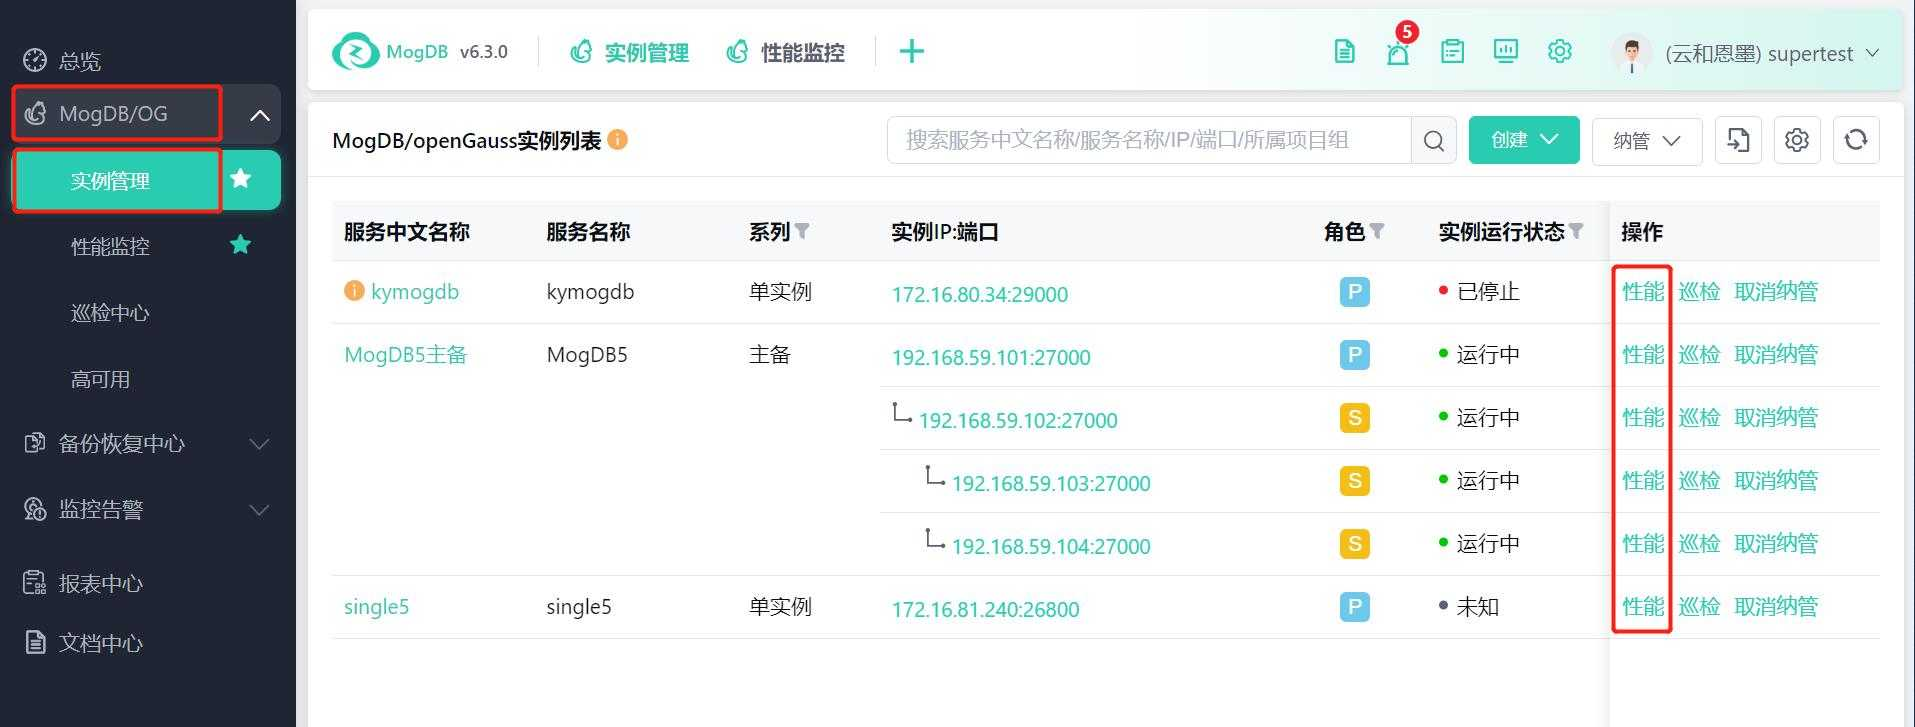
Entrance 2: MogDB/openGauss --> Instance Management --> Click on the performance button in the operation column
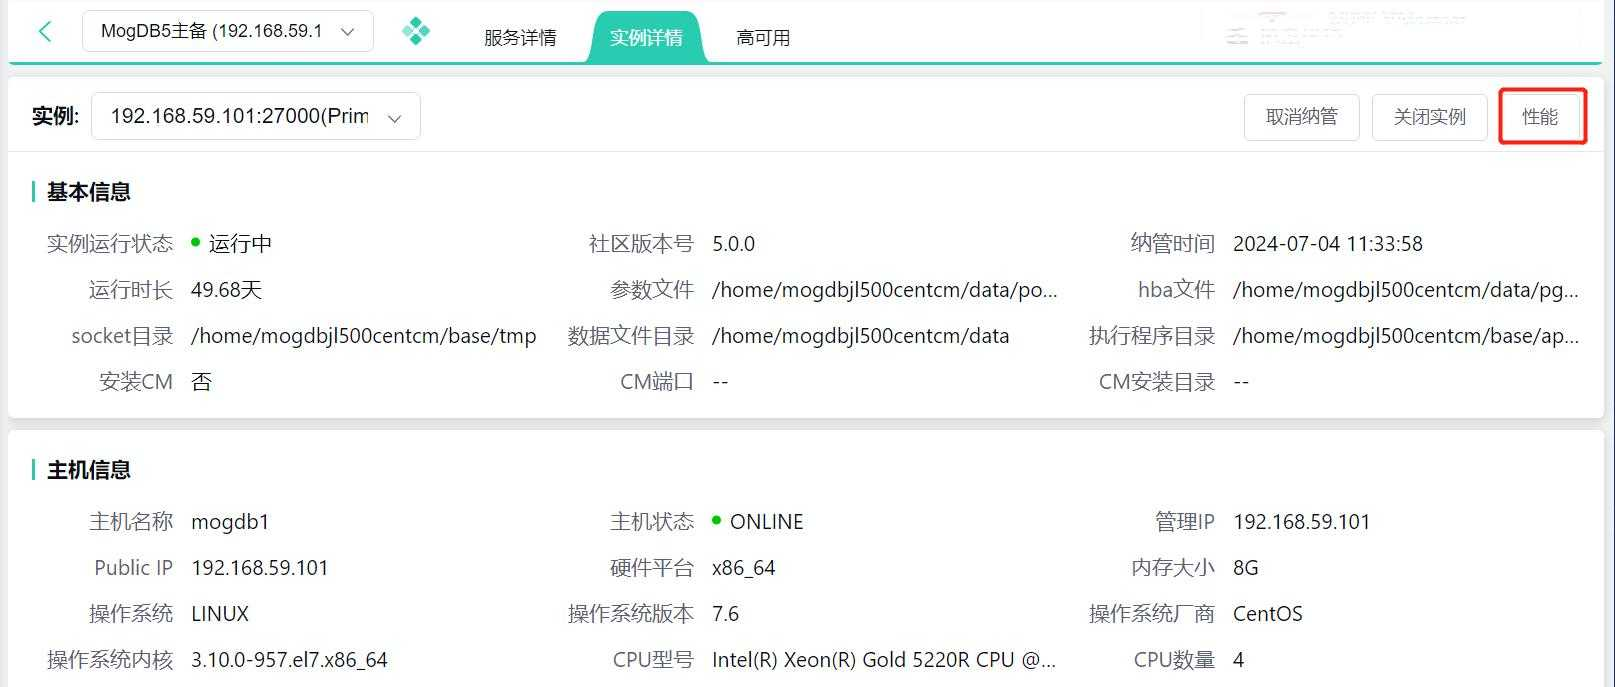
Entrance 3: MogDB/openGauss --> Instance Management --> Instance Details --> Performance button
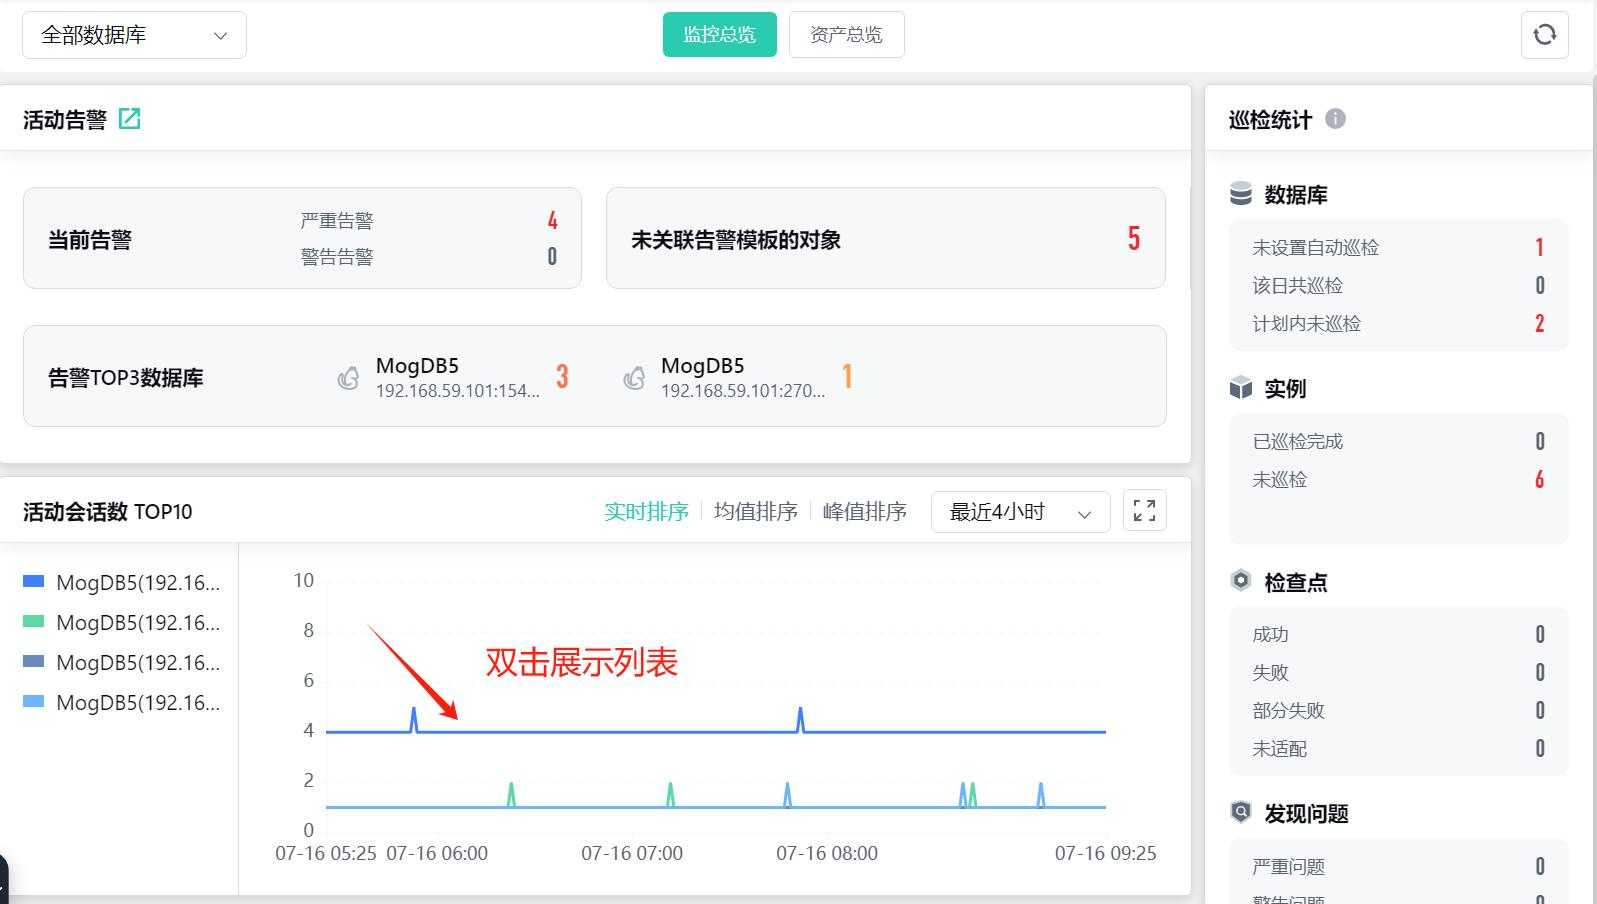
Entrance 4: Overview --> Monitoring Overview --> Double-click to display the database list --> Click on the Chinese name to jump to the corresponding database performance details
Function Description
This page allows you to view real-time/historical performance metrics of instances, including trends of user activity sessions categorized by wait types. When hovering over the trend graph, it displays the number of active sessions at the corresponding time point. It also allows you to drag the time frame to display the corresponding Top SQL and Top Events, Top Sessions, and Top Clients within the selected time range.
- Activity Session Trend Graph: Defaults to the last 1 hour. Click the time icon in the upper right to quickly select the last 1 hour, last 2 hours... last 48 hours. You can also customize the start and end times, with the longest time being the last 48 hours.
- Auto-refresh: The page is set to close auto-refresh by default. Click the auto-refresh to choose the page refresh frequency of 30S, 1min, 5min, 15min. Click the auto-refresh switch to toggle page auto-refresh.
- Time Frame Size: Defaults to 12 minutes. Hold and drag the mouse left button to select the time range in the chart area, with a minimum selection of 1 minute. The time frame is a light blue box on the real-time activity session (number) trend graph. Dragging the time frame dynamically displays the number of active sessions for each wait event type within the time range. The page dynamically displays the TOP objects within the time range at the bottom.
- Performance Metrics: Quickly jump to the "Historical Sessions" and "Performance Charts" sub-pages to view the key performance metric trends and values of databases and hosts, and combine performance metrics with problem phenomena to troubleshoot and locate issues.
Use performance analysis in the following scenarios:
-
Business SQL overhead is too large, causing the database to slow down.
-
DML statements are blocked and deadlocked.
-
The database suddenly restarts or crashes. Analyze performance data before the restart; the database is unresponsive, analyze performance data before the database was unresponsive.
-
Investigate spiky and business performance fluctuations.
Operating Instructions
Select the corresponding cluster from the drop-down menu, select the "Database" and "Instance" drop-down menus to select other nodes of the cluster, and display performance data:
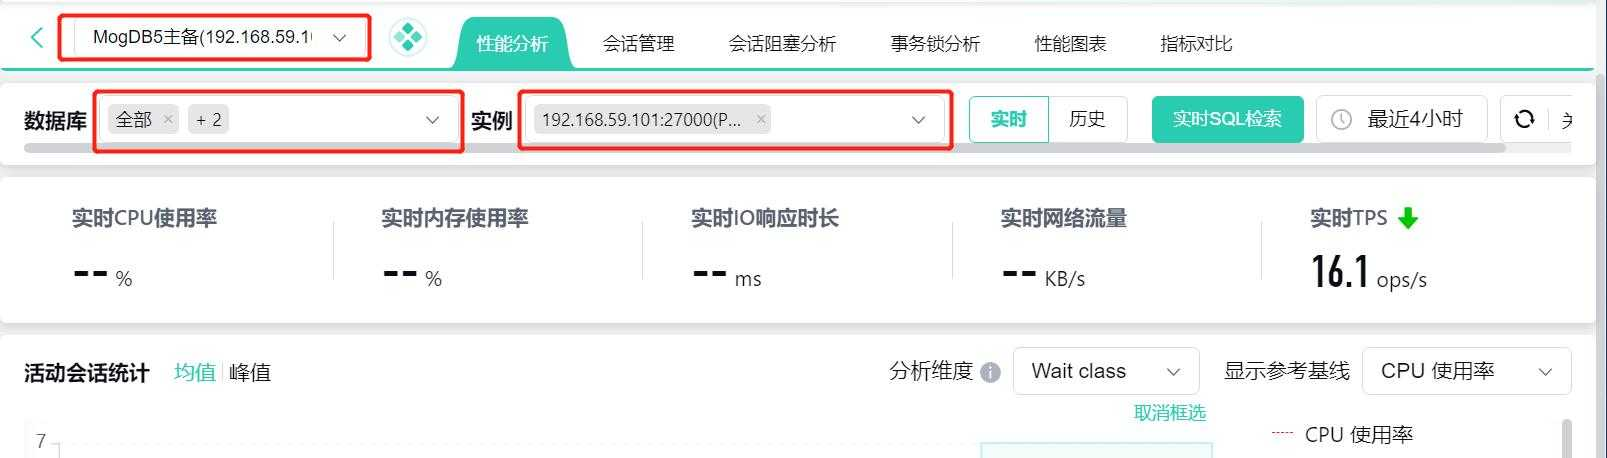
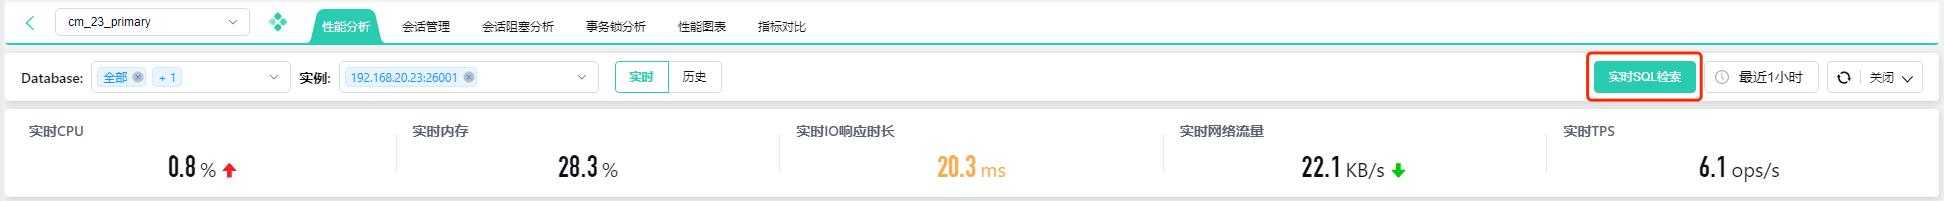
Analyze Real-time Database Core Resource Metrics
Support multi-select instances for comparison, the real-time performance analysis page header displays the statistics and changes of the current database core metrics, which can help identify issues at the earliest time for further analysis.
Data will be compared based on the last 10 minutes, with an upward red arrow and a downward green arrow. When the threshold is exceeded, the value will be yellow. Hover over the number and arrow to display hint information, comparing the current largest instance with the average value of the last 10 minutes.

Analyze Real-time Sessions
Analyze real-time active session charts, default to the last 1 hour, analyze active session charts, support peak and average value statistics, and the chart supports displaying TOP objects by selecting a time frame.
The chart analyzes ASH statistics by specific dimensions:
- Analyze by Wait Class
- Analyze by Top SQL
- Analyze by Top Event
Support displaying and hiding reference baselines:
- CPU Usage
- CPU Logical Cores
- Historical Performance Baseline
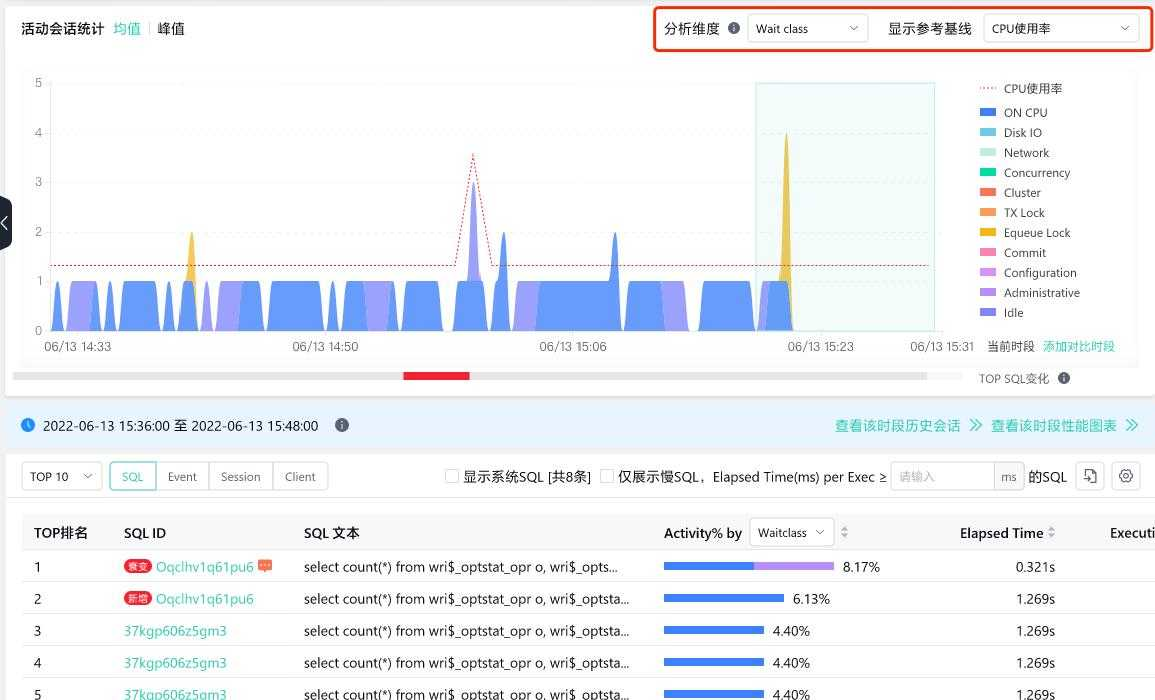
Click "View Historical Sessions for This Period" or "View Performance Charts for This Period" to jump to the corresponding historical sessions or performance charts.

Analyze Historical Sessions
Select the historical time by default to the last 1 month, and analyze the dimension by default to TOP SQL, and count by total occurrences. Analyze the TOP SQL trend within the historical period to find tuning target SQL and performance trends.
- Support selecting a specific time range to display SQL
- Support double-clicking to drill down to a smaller time granularity, with the smallest unit being hours
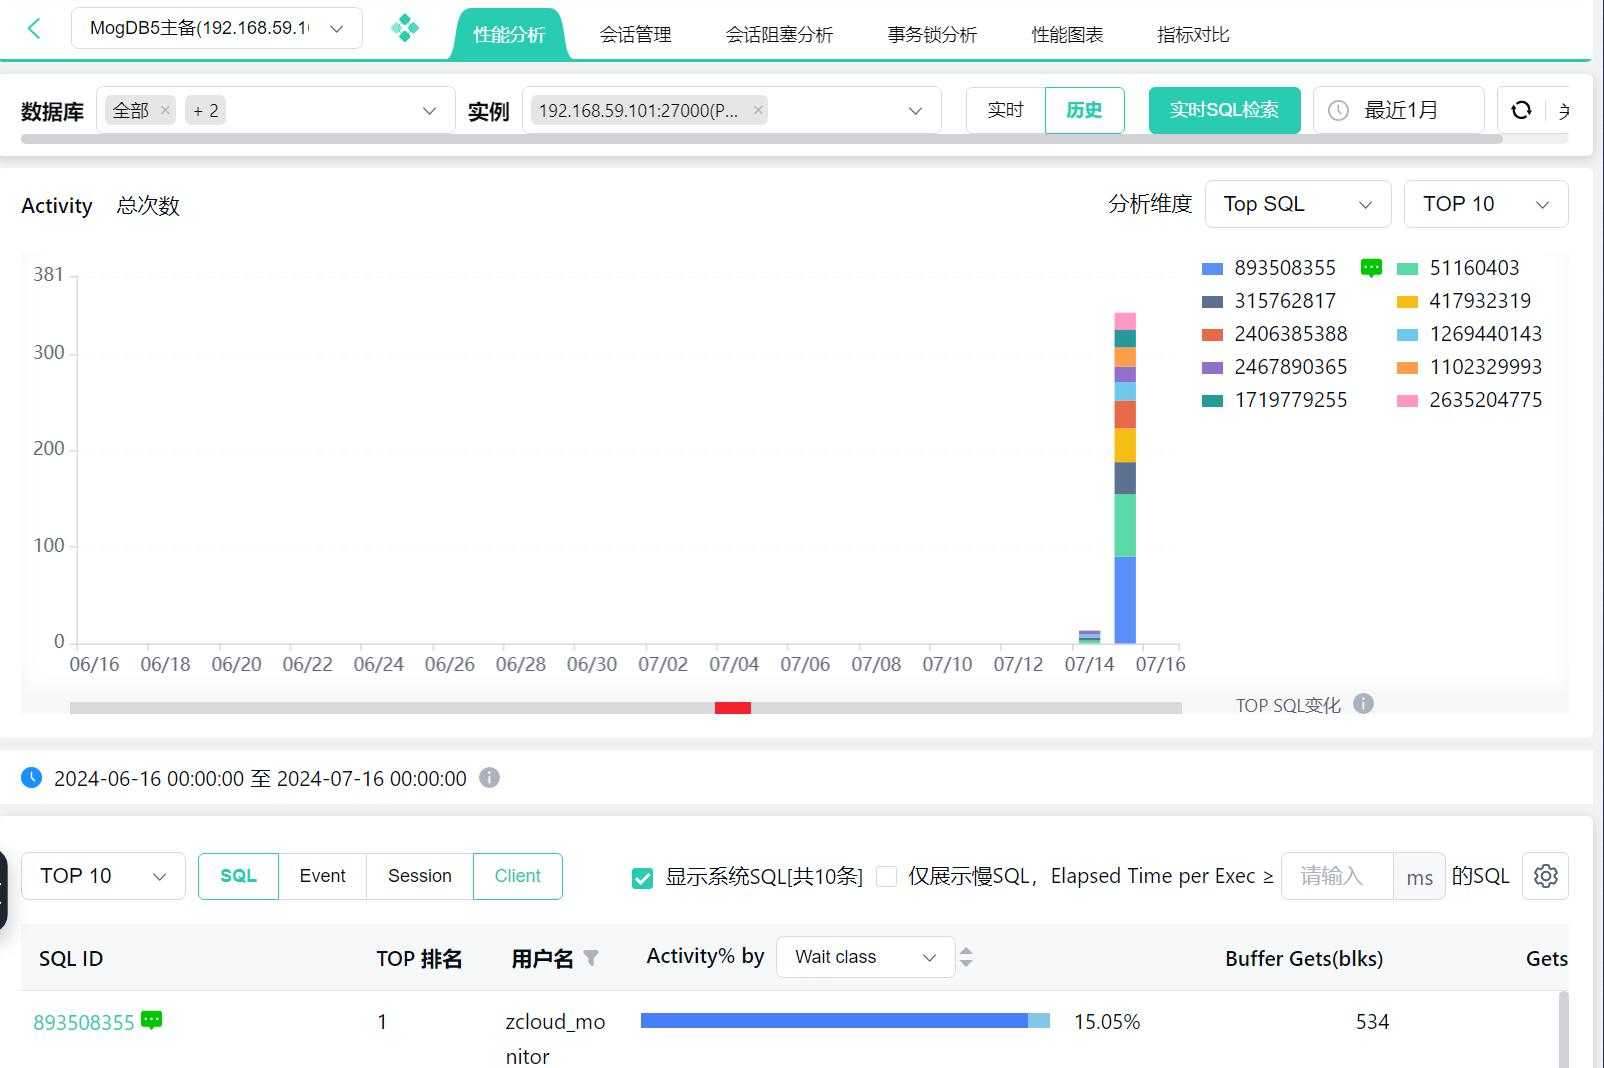
Analyze TOP Objects
The list displays the TOP SQL, TOP Event, TOP Session, and TOP Client for the selected time frame; the TOP drop-down menu can select 5, 10, 25, 50; different databases display different fields. All lists support custom menus.
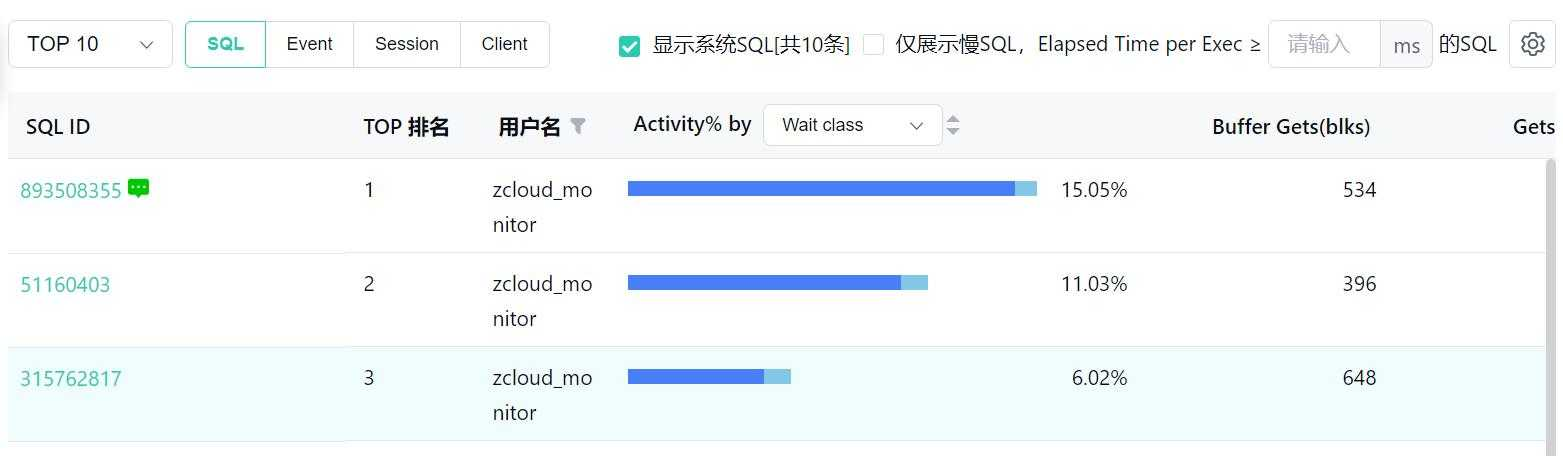
TOP SQL
The list marks new and declining SQL, supports SQL remarks function; TOP SQL Activity is divided into the following 4 dimensions: Waitclass, Event, Client, Application, default Waitclass. Compare SQL by different dimensions.
Support displaying system SQL and counting the number of system SQL statements, default not checked, this function is used to block platform and system SQL statements.
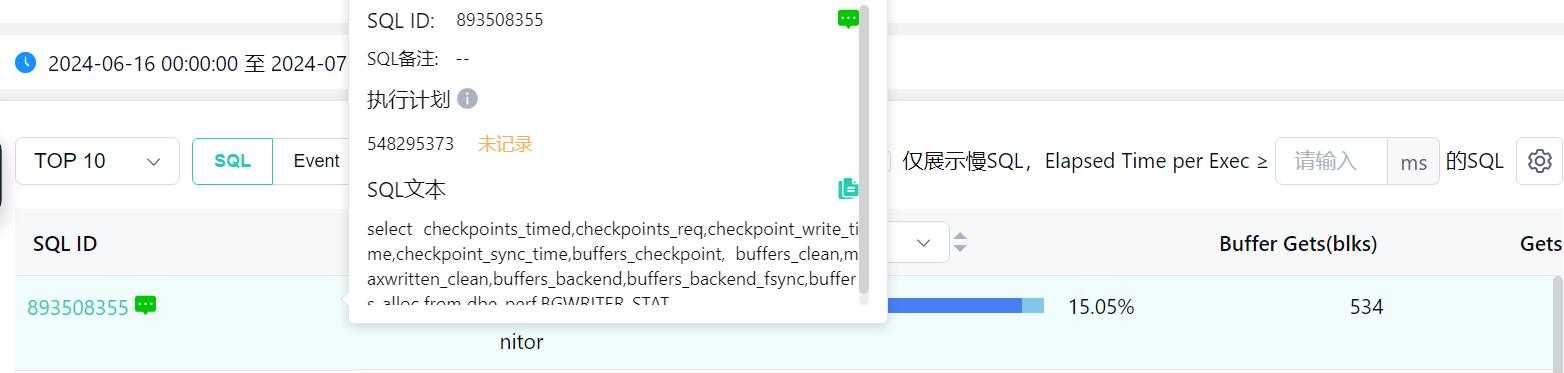
Hover the mouse over the SQL ID to display the complete SQL ID, execution plan, and SQL text. Support adding SQL remarks and copying SQL text.
SQL Remarks:
Click the SQL remark button to display the add SQL remark popup window, select SQL classification, set remark tags, SQL remarks, optimization records, and associate expert knowledge base. After adding, the SQL ID will display the corresponding remark chart, click to view remark information, and support deleting remarks.
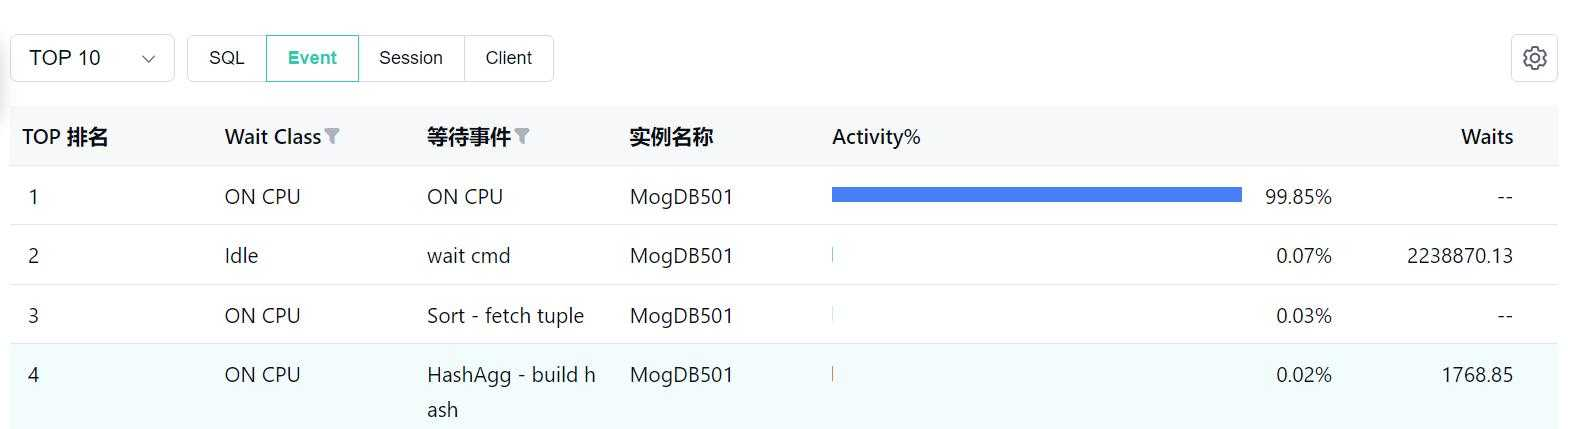
TOP Event
After dragging the time frame selection, click "Event" below to switch to the Wait Event page, displaying the most significant waiting event.
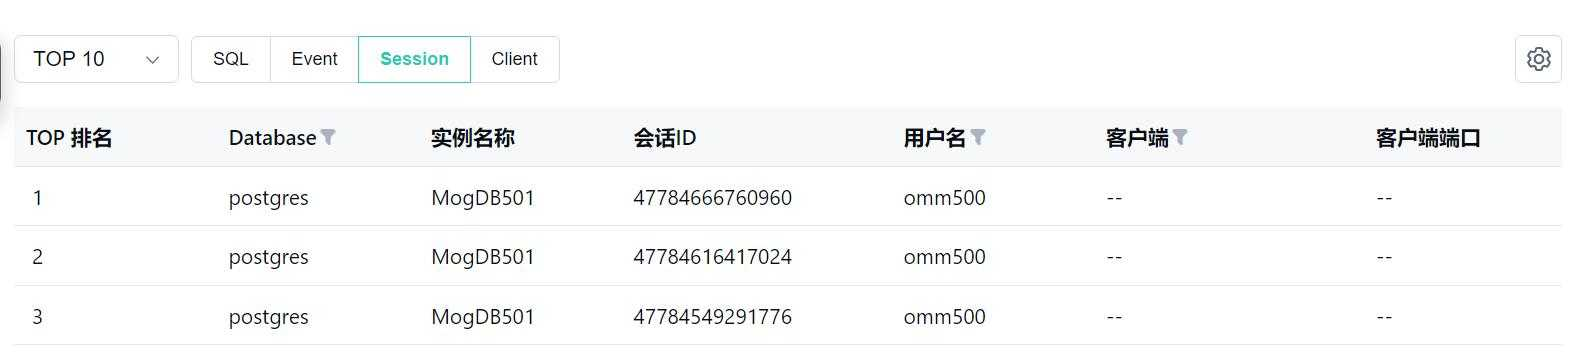
TOP Session
After dragging the time frame selection, click "Session" below to switch to the Top Session page, displaying the most significant Session and machine information.
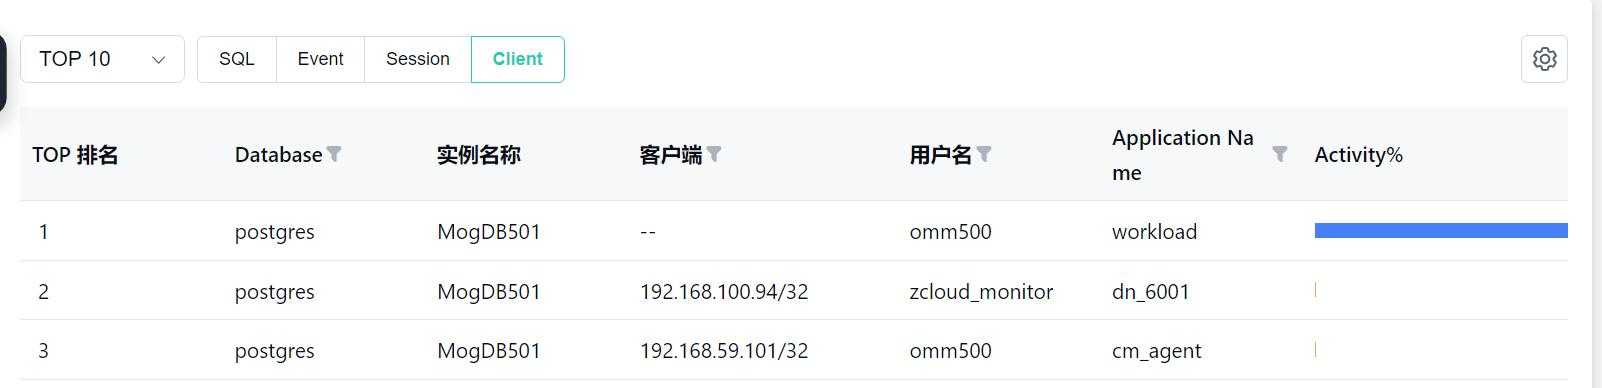
TOP Client
After dragging the time frame selection, click "Client" below to switch to the Top Client page, displaying the information of the related Machine and Program, and the corresponding machine user and proportion.
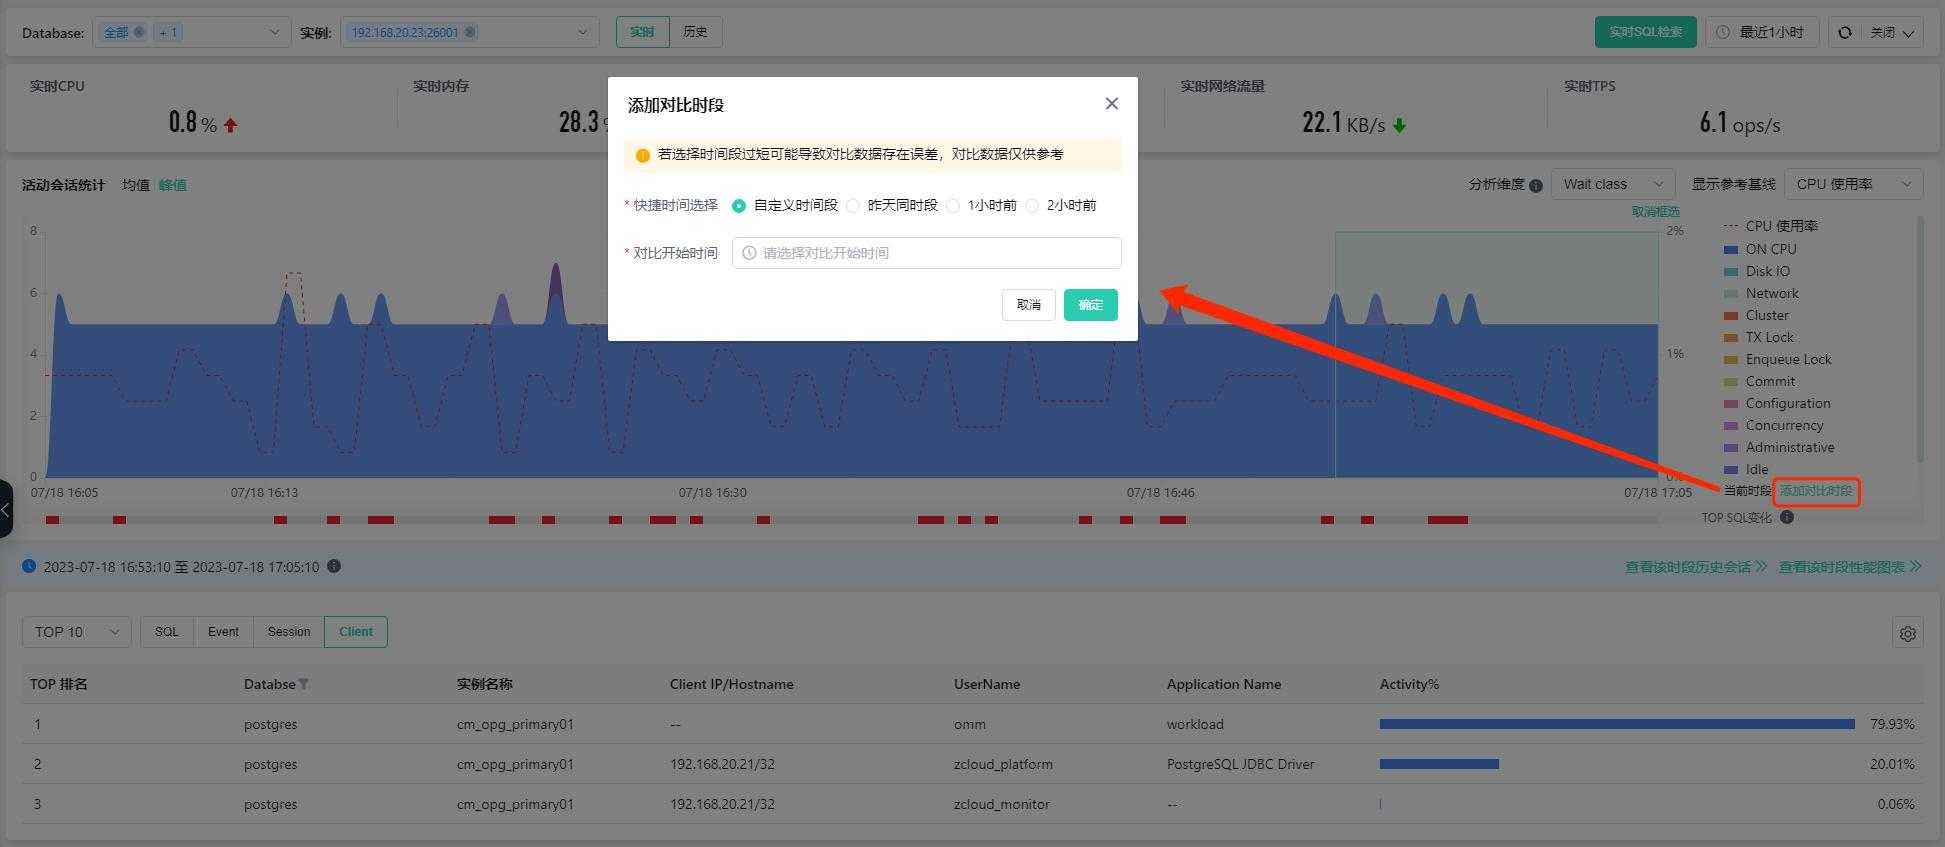
Add Comparison Period
Support adding a comparison period, click the add comparison period button on the timeline, display the add comparison period popup window, select the comparison start time or quick time option (custom time segment, yesterday's same period, 1 hour ago, 2 hours ago) confirm to add a simultaneous period comparison horizontal coordinate, display the average curve of the comparison period.
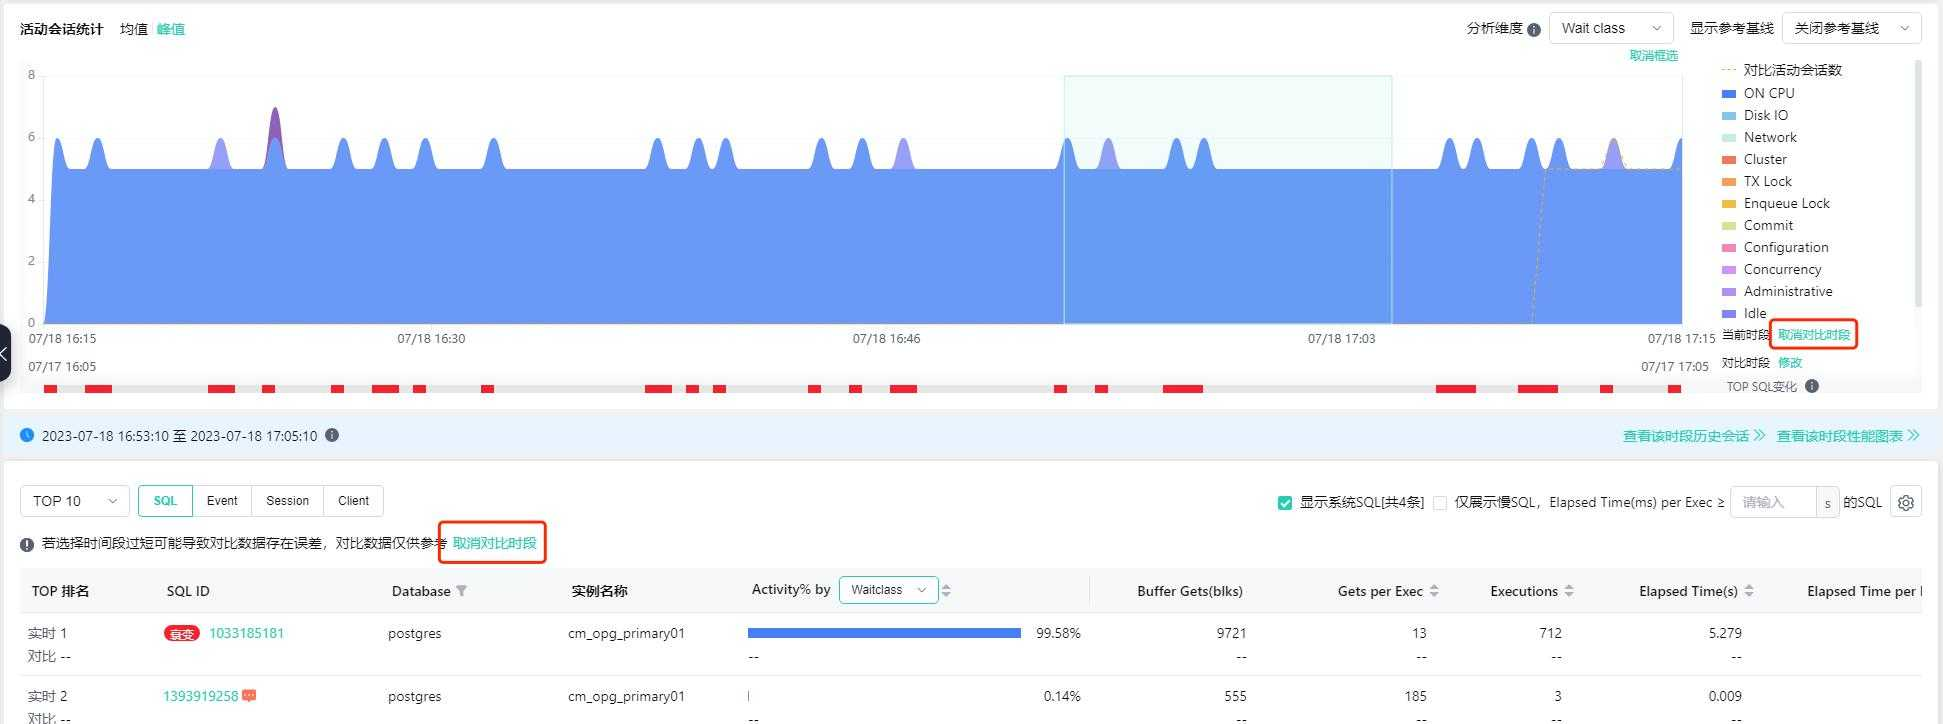
TOP objects display data for the comparison period.
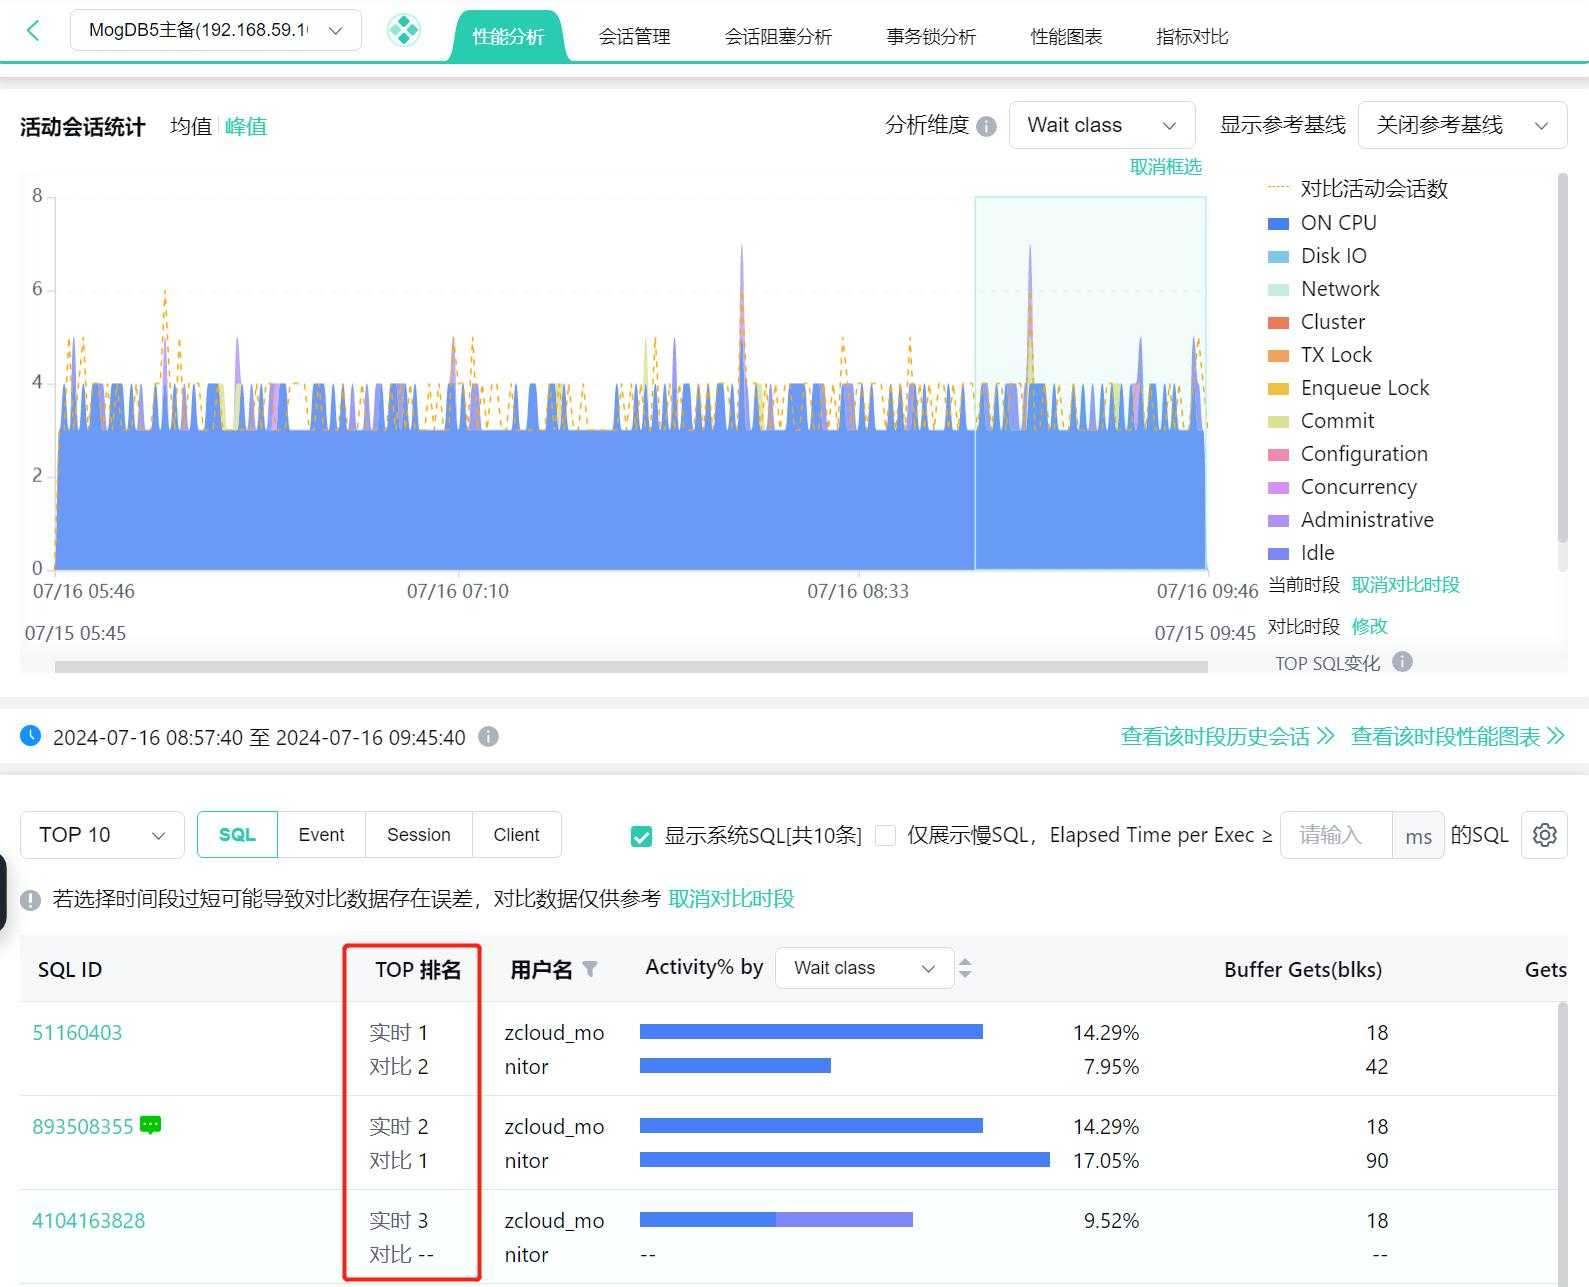
After adding a comparison period, it is displayed, and you can cancel the comparison period:
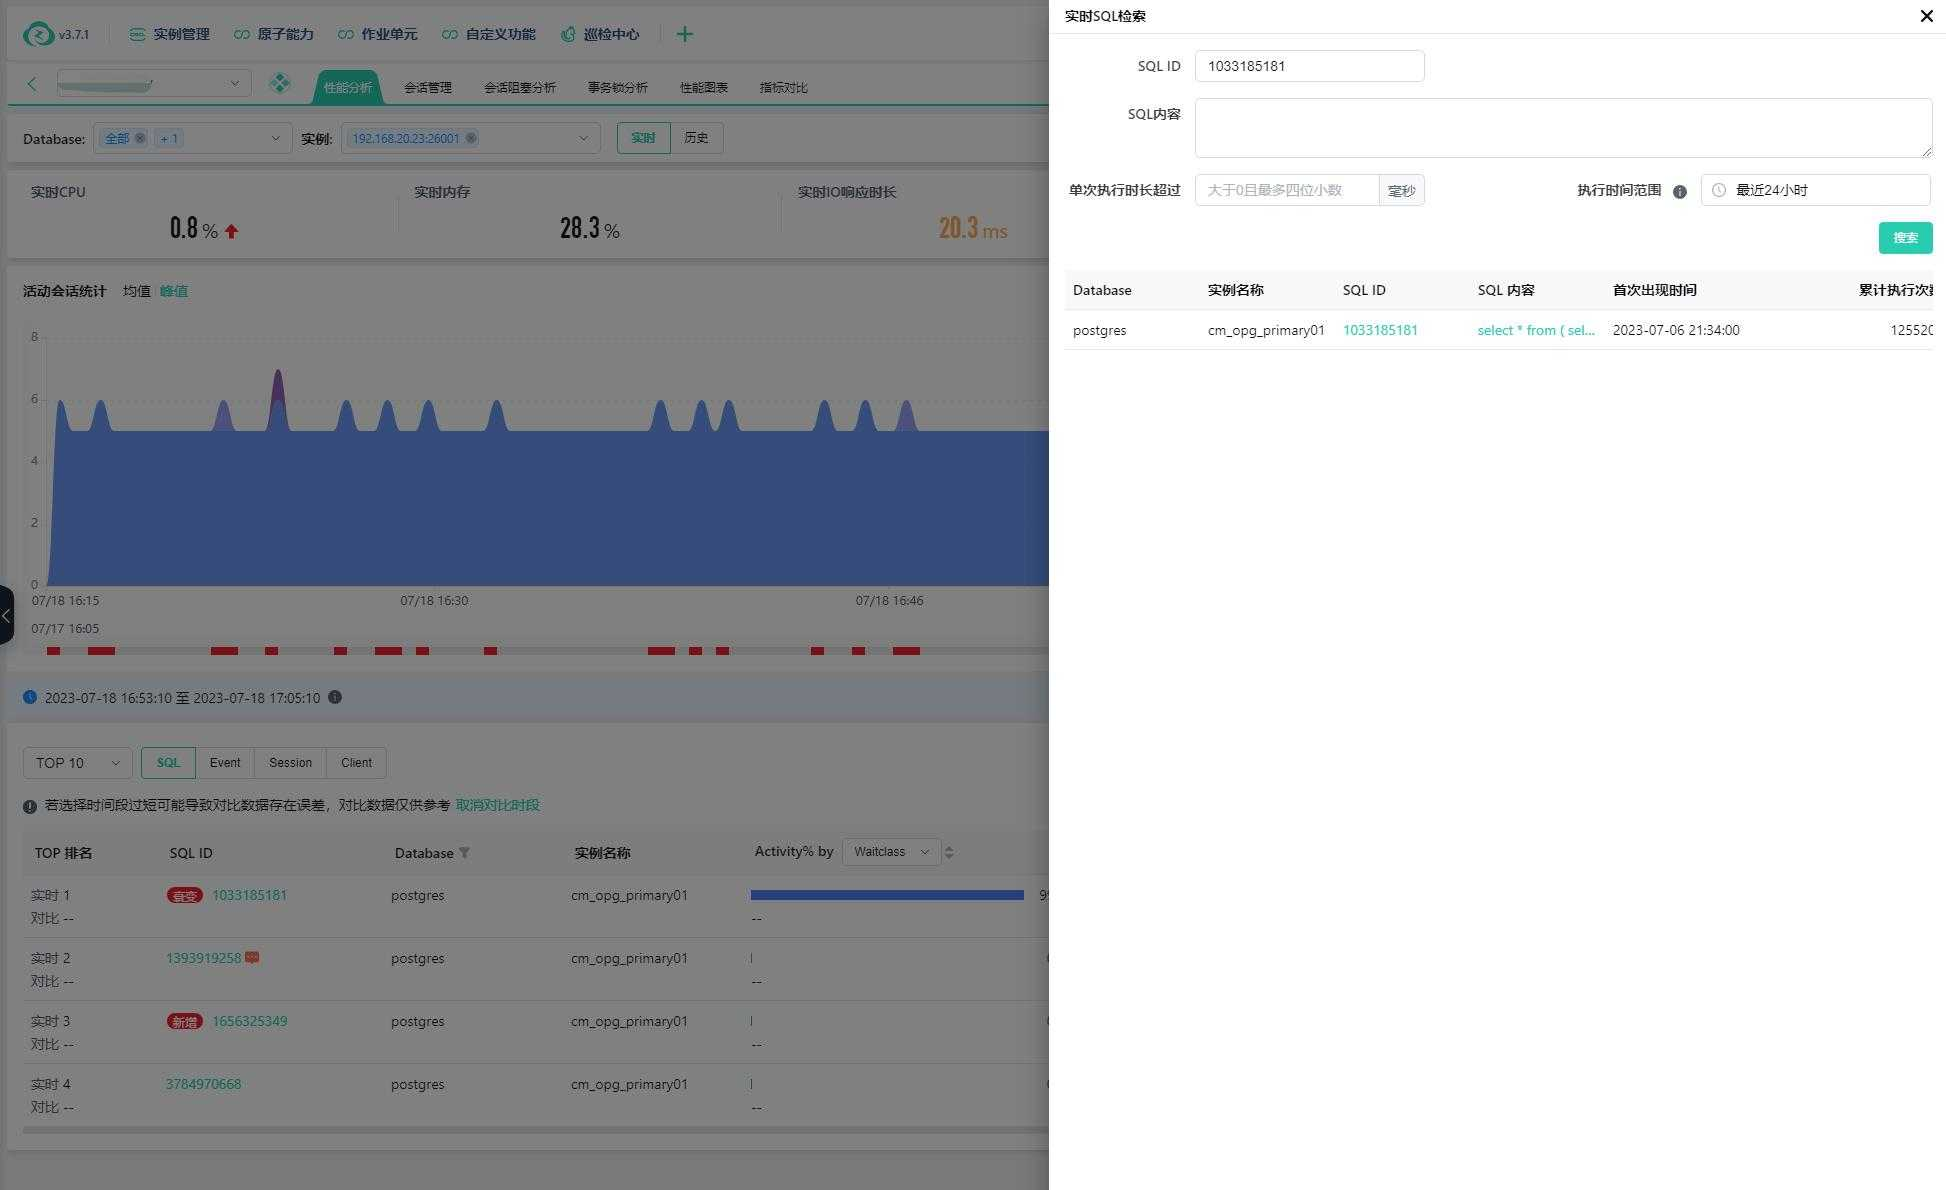
Real-time SQL Search
Click the real-time SQL search button to display the SQL search popup window. You can filter and search real-time SQL by SQL ID, text content, single logical read, single execution duration, single CPU duration, and execution time range.
Search results: