- About
- Basic Features
- Introduction
- Platform Tenant Management
- Platform User Management
- TOTP Certification
- Basic Data Definition
- Media Management
- Command Management
- Mail Server Configuration
- Job Center
- Platform Host Resource Pool
- Platform Database Pool
- Platform Proxy Nodes Management
- Platform Components Management
- Additional Information Management
- Operation Log
- Connection Concurrency Configuration
- Customization of Platform Styles
- Parameter Templates
- License
- Monitor Large Screen
- Overview Display
- Tenant User Management
- Tenant Host Resource Pool
- Tenant Proxy Nodes Management
- Menu Management
- Report Center
- MogDB/openGauss
- Backup Recovery Center
- Monitoring
- Alert Center
- Inspect Center
Overview Display
Function Entrance
Expand the left-hand menu --> Overview
Function Description
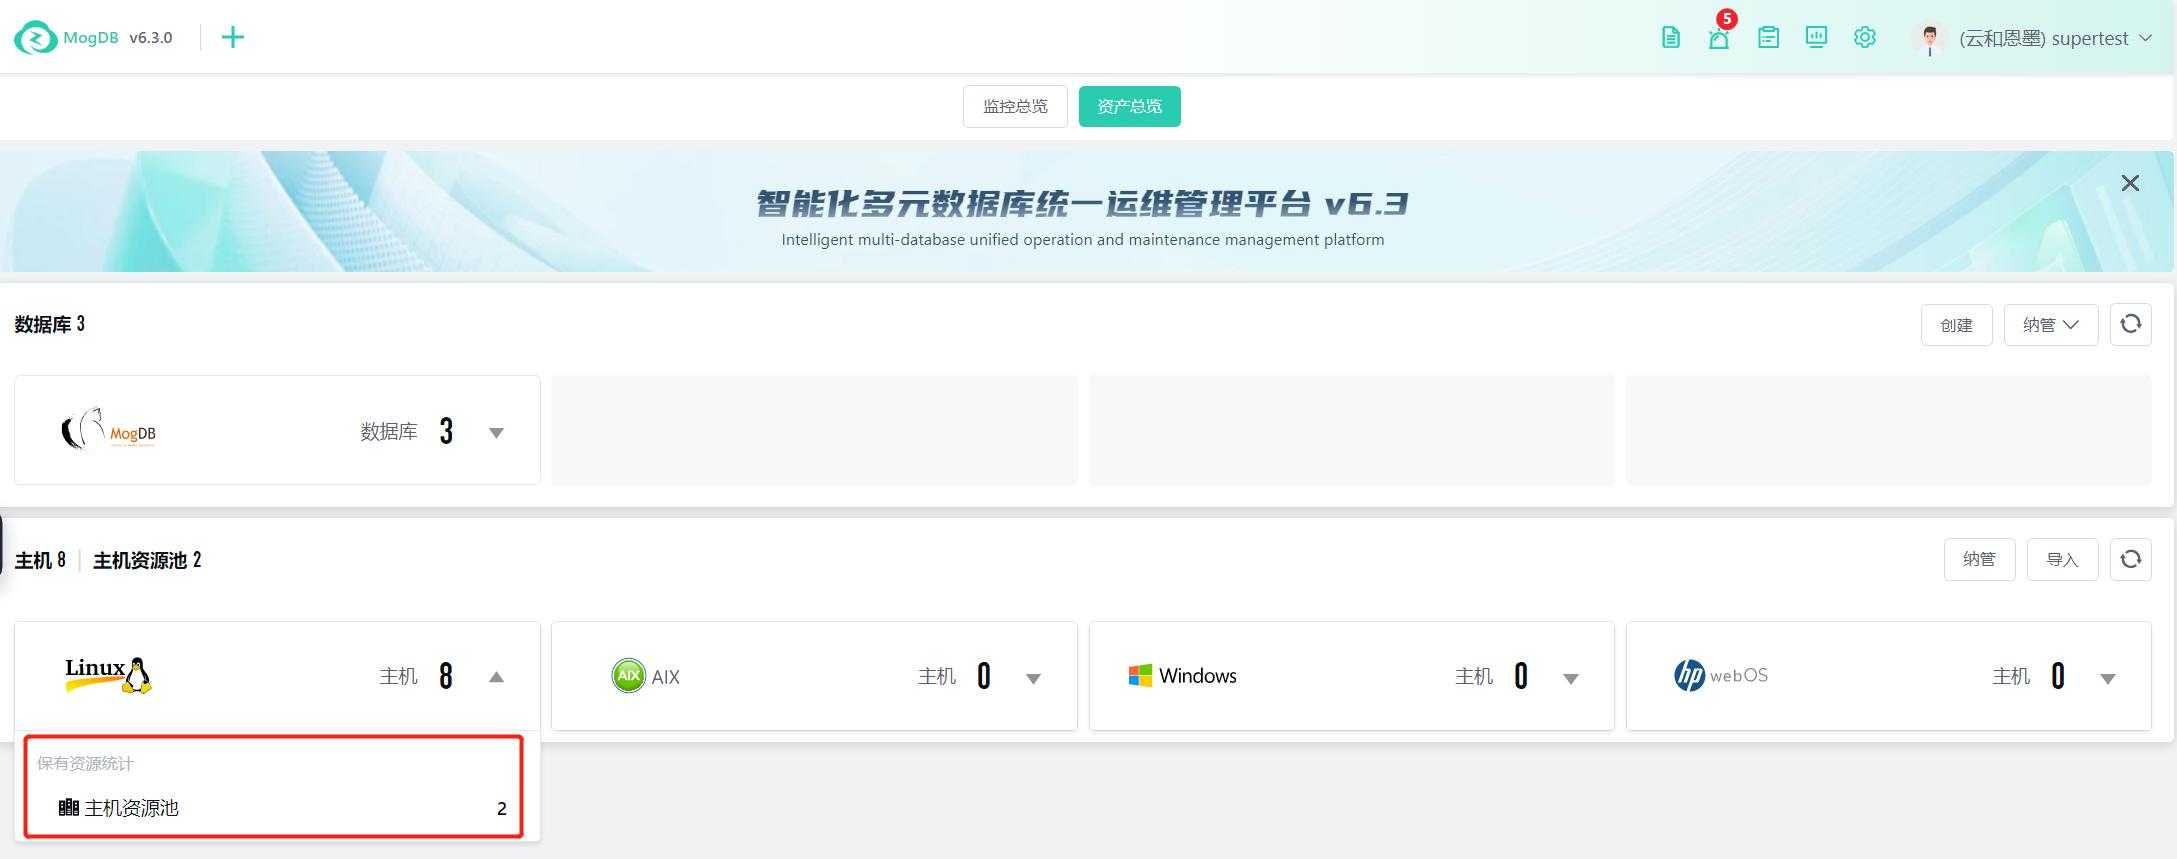
On the Overview page, you can view a detailed summary of all databases in the platform; the Overview is divided into two perspectives: Monitoring Overview and Total Assets Overview.
Monitoring Overview: Statistics and display of alert situations, database health, performance charts, inspection conditions, and other information.
Total Assets Overview: Statistics and display of the types and quantities of managed hosts and databases under the current tenant; this page also provides entry points for creating databases, managing databases, and managing hosts.
Operating Instructions
Monitoring Overview
Switch between monitoring and asset perspectives through the top tabs;
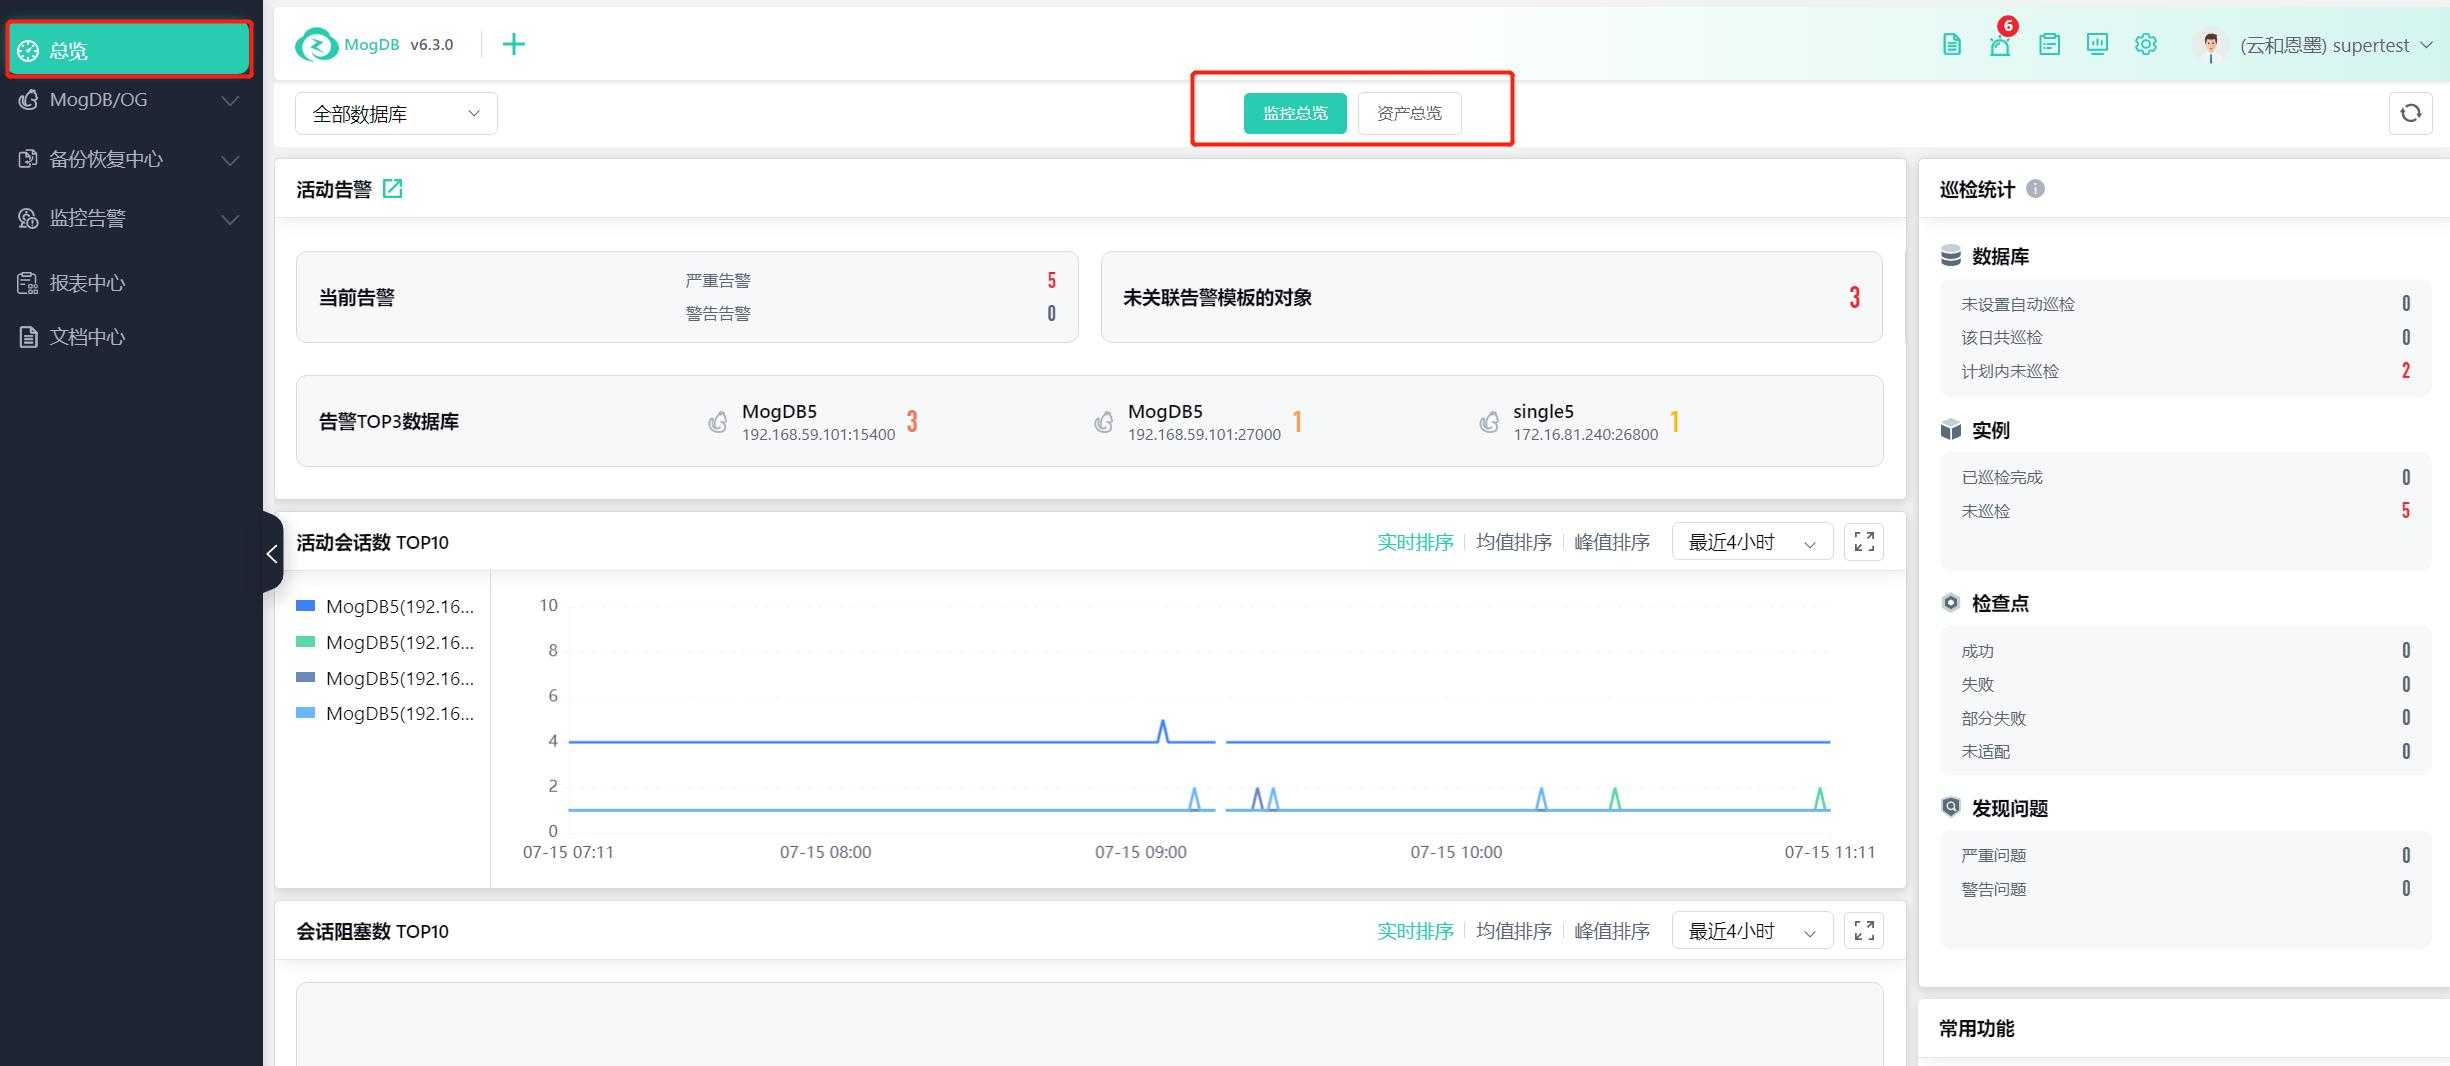
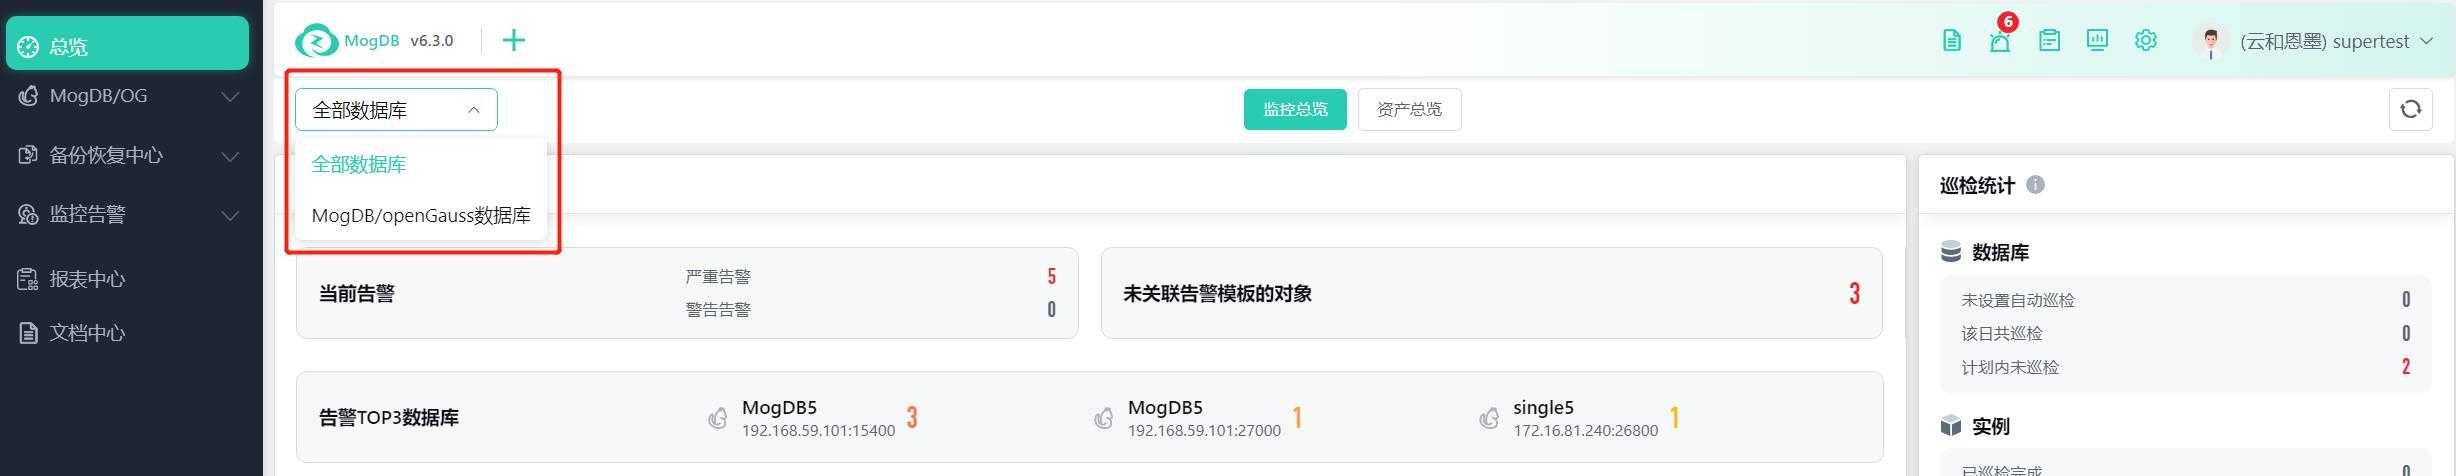
When viewing the monitoring overview, you can select a specific database type for statistics in the upper left corner of the page, with all databases displayed by default;
The page displays an overview of active alerts, and you can drill down to the Alert Center by clicking the numbers or the transfer icon in the title;
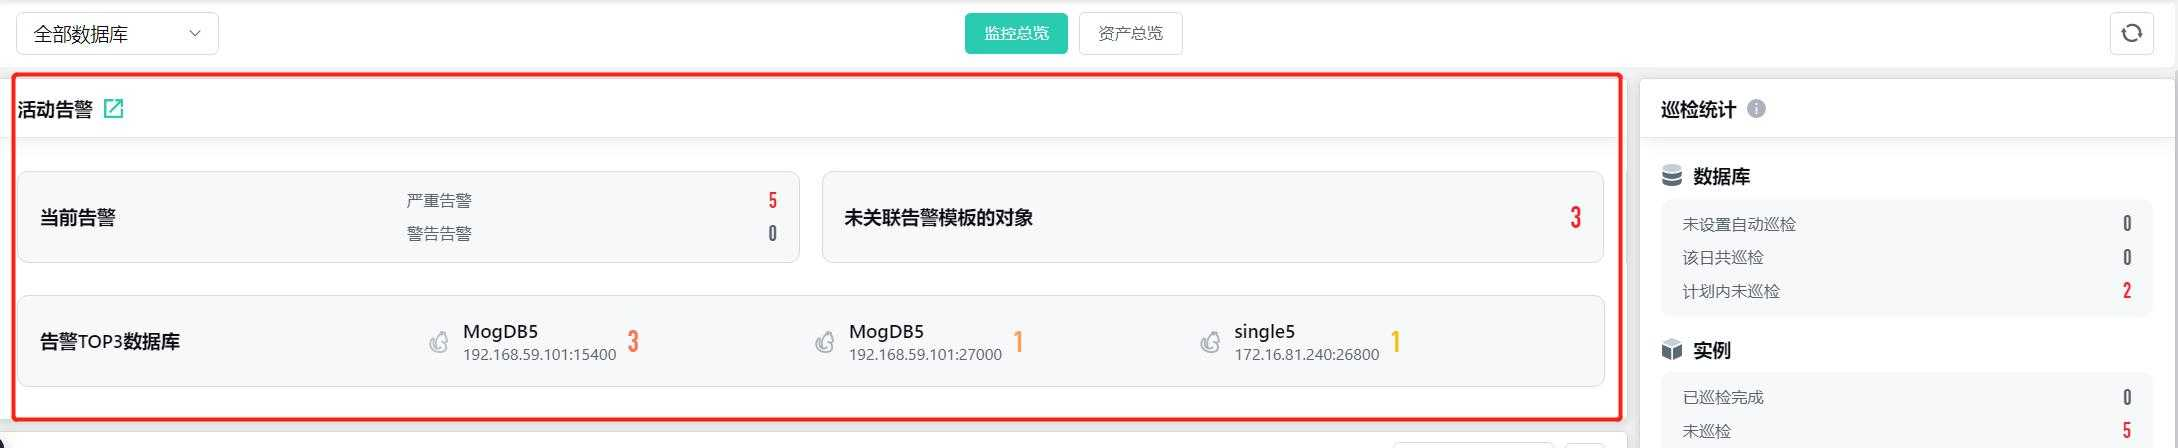
The page displays a statistical overview of inspection results, and when the statistical object is a single database, you can drill down to the corresponding database inspection center to view the summary of inspection issues;
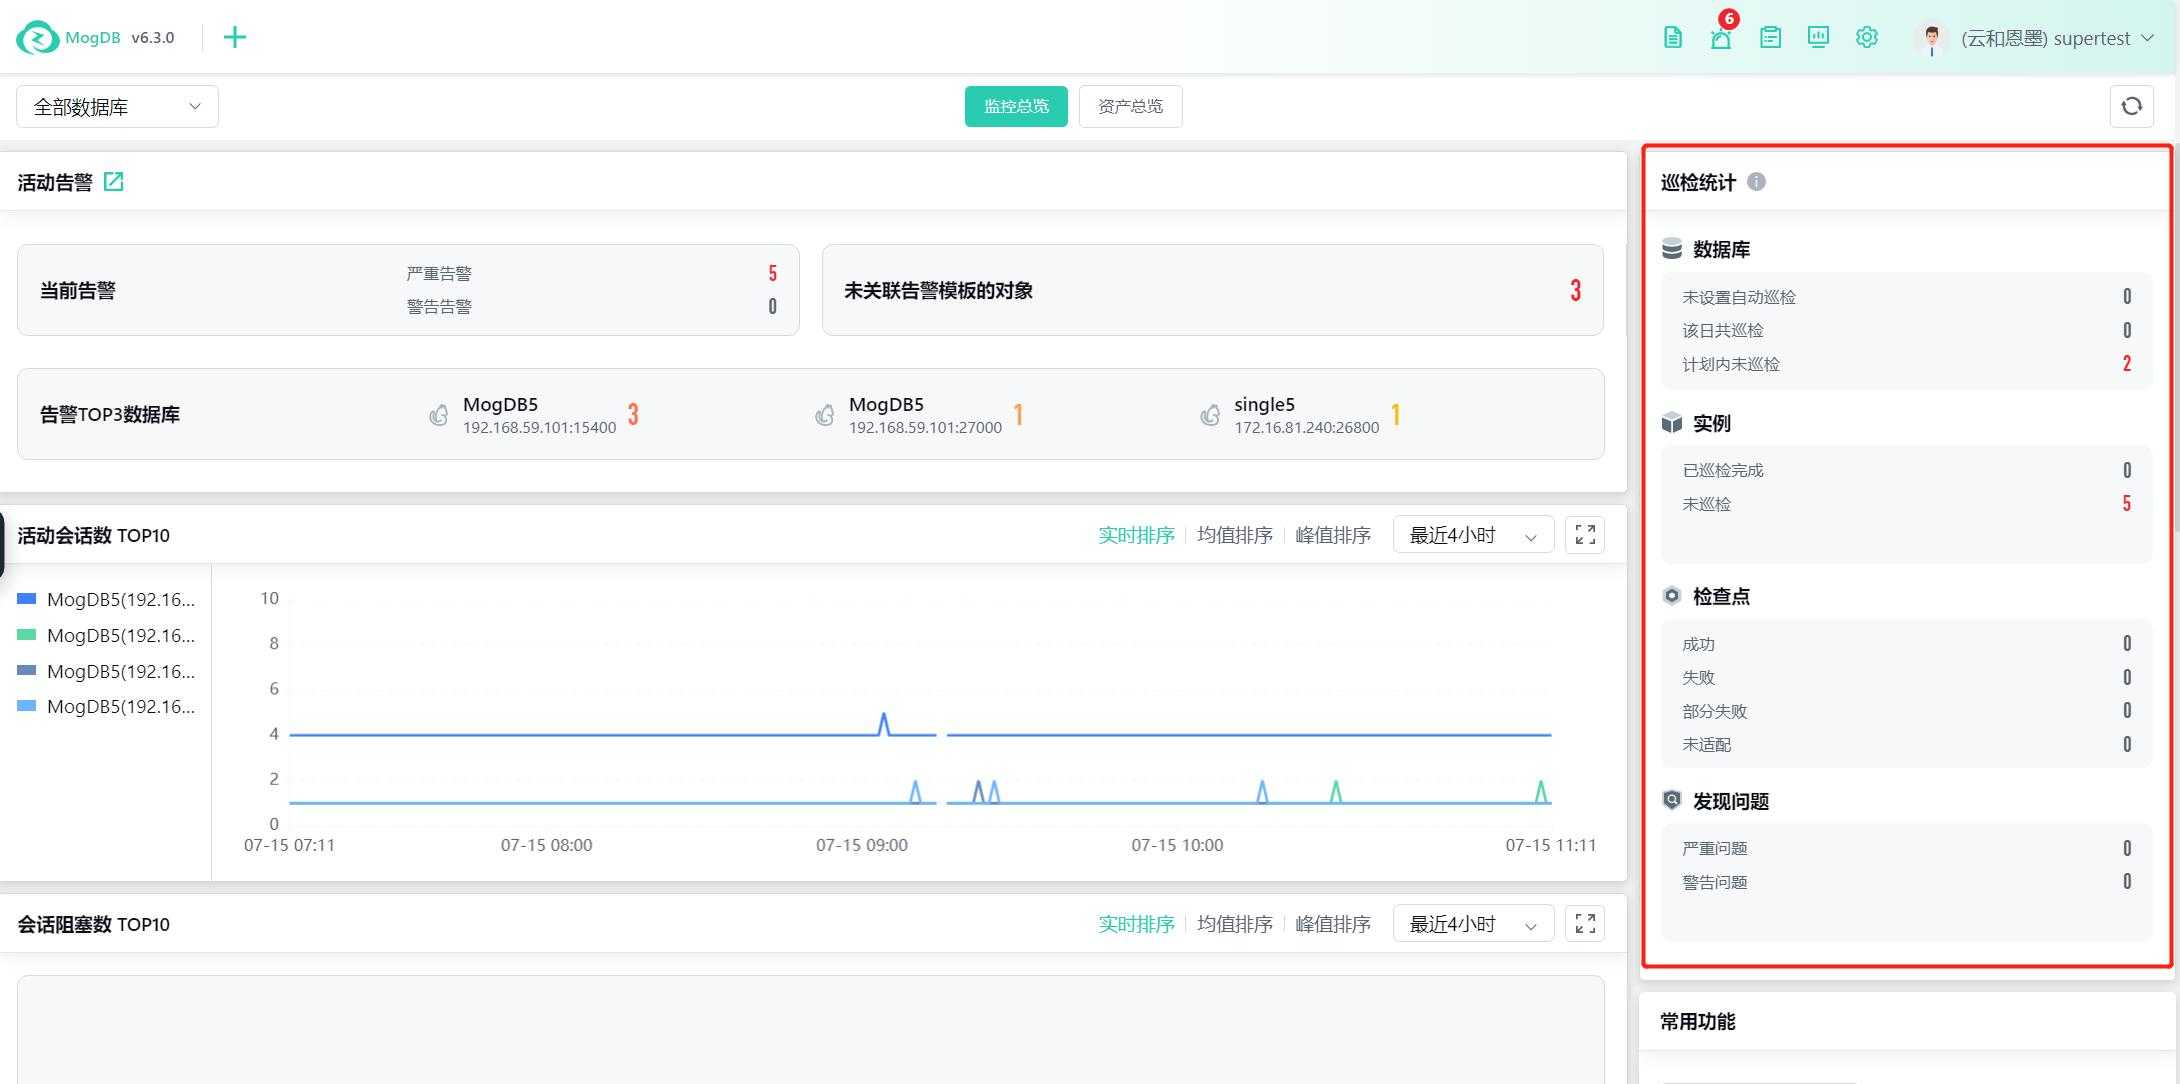
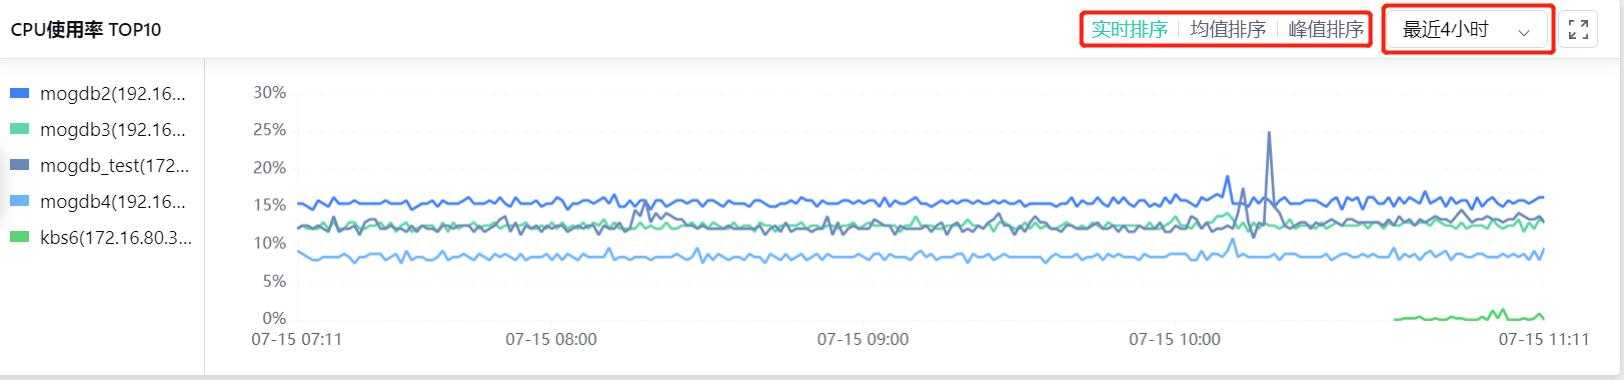
The performance chart section displays CPU usage, memory usage, IOPS, Page In, and active session numbers, and you can sort the charts and select the viewing time;
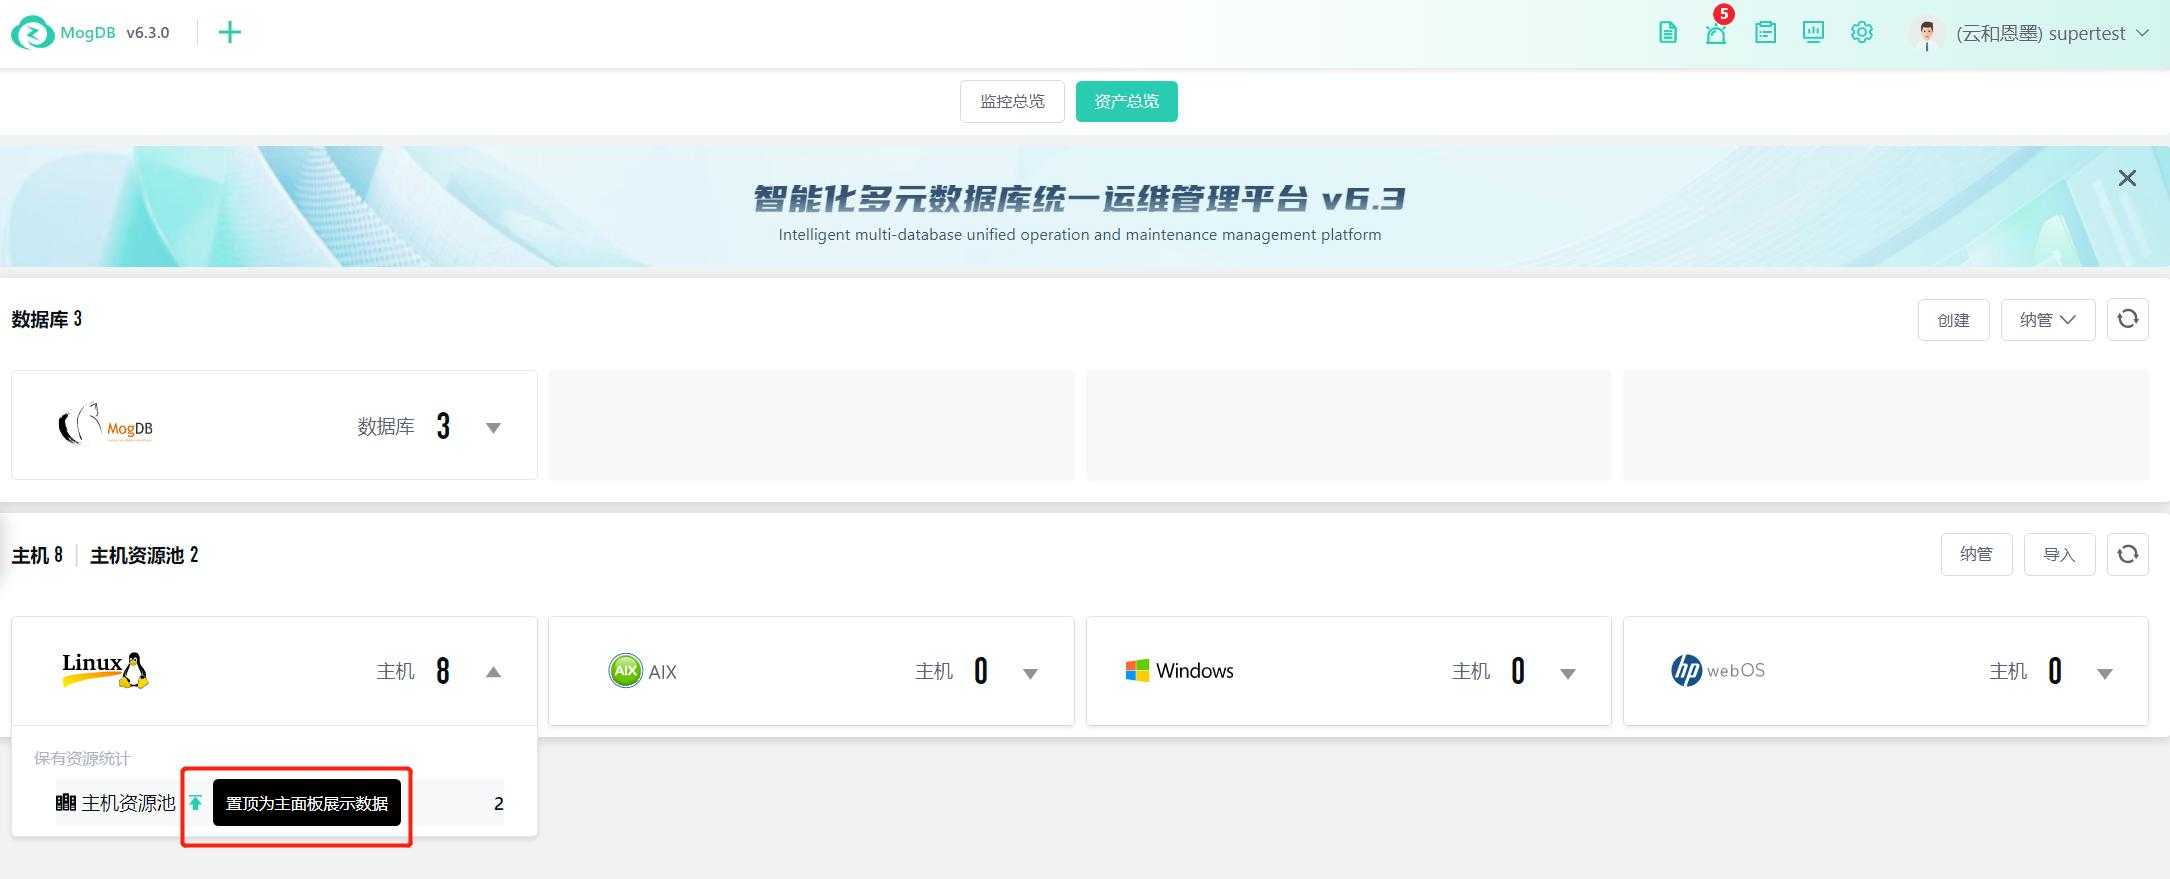
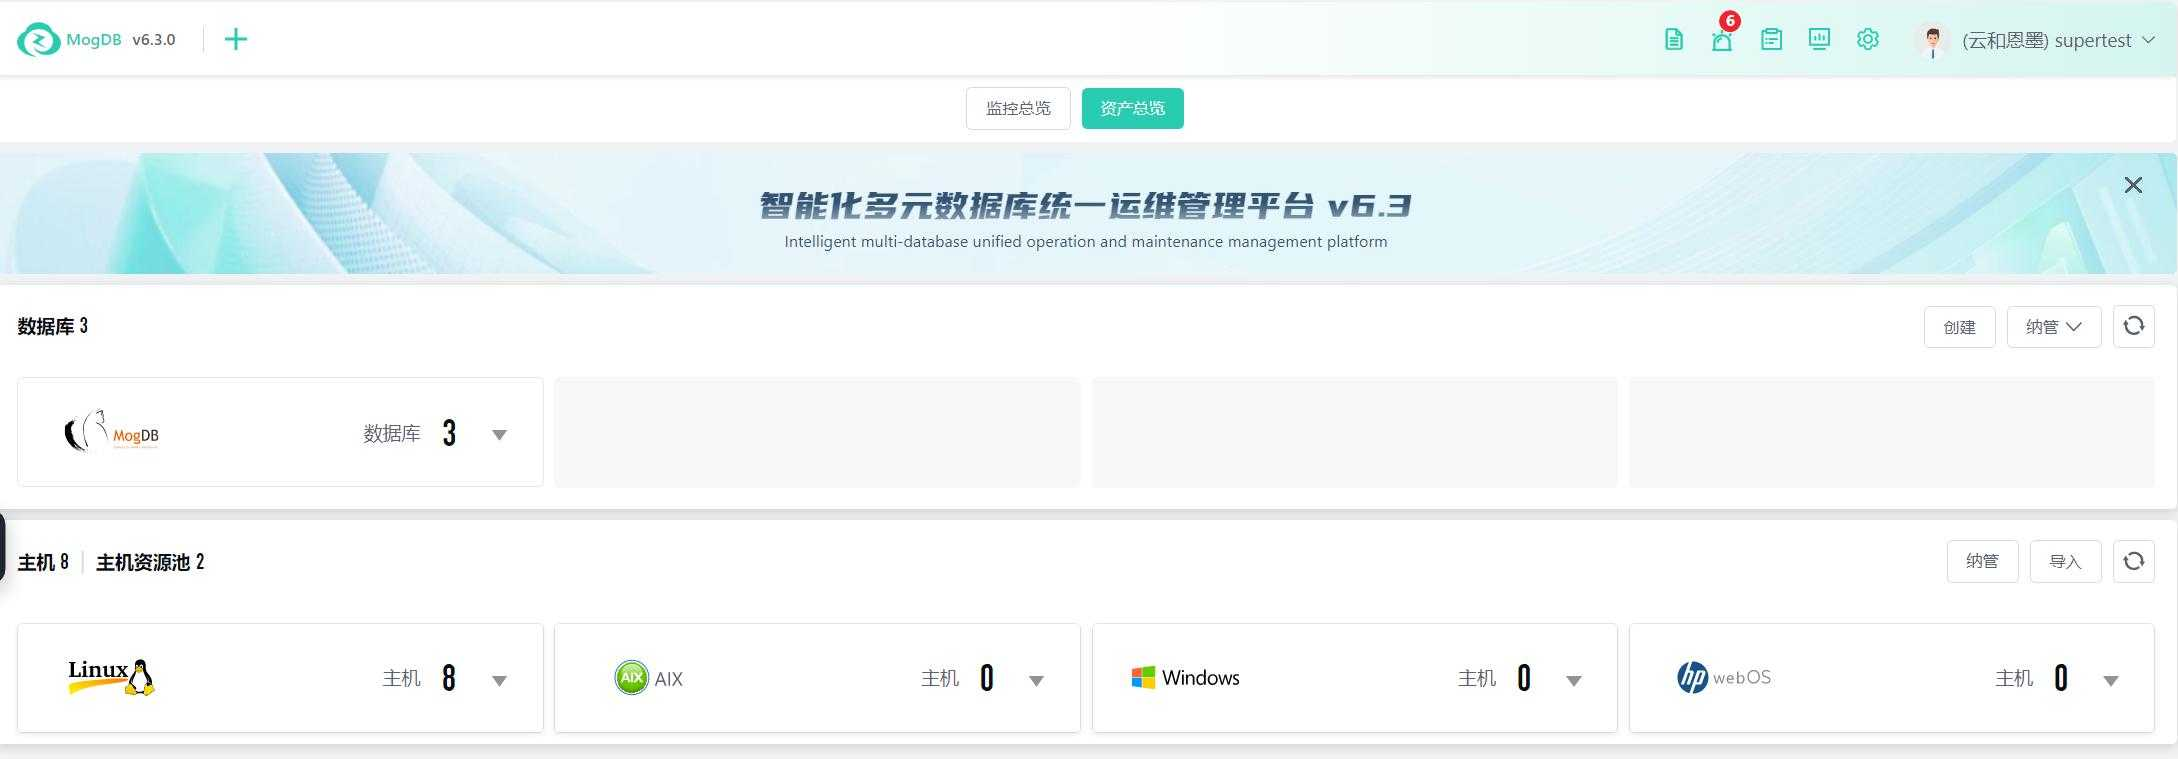
Total Assets Overview
Under the Total Assets Overview perspective, you can view the quantity of machines used by all databases and the number of hosts in the corresponding host resource pool for that type of database;
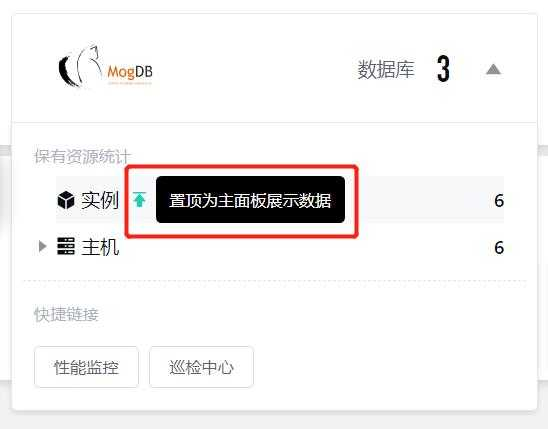
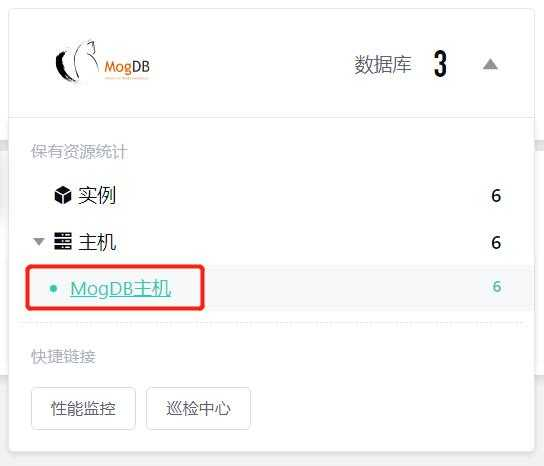
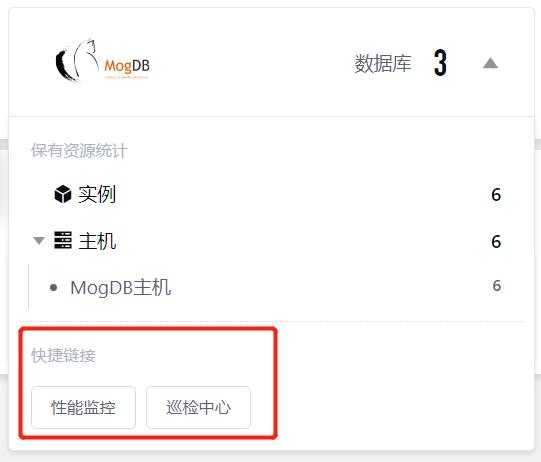
When hovering over the database resource card, expand the resource statistics list and quick transfer link buttons under that database type;
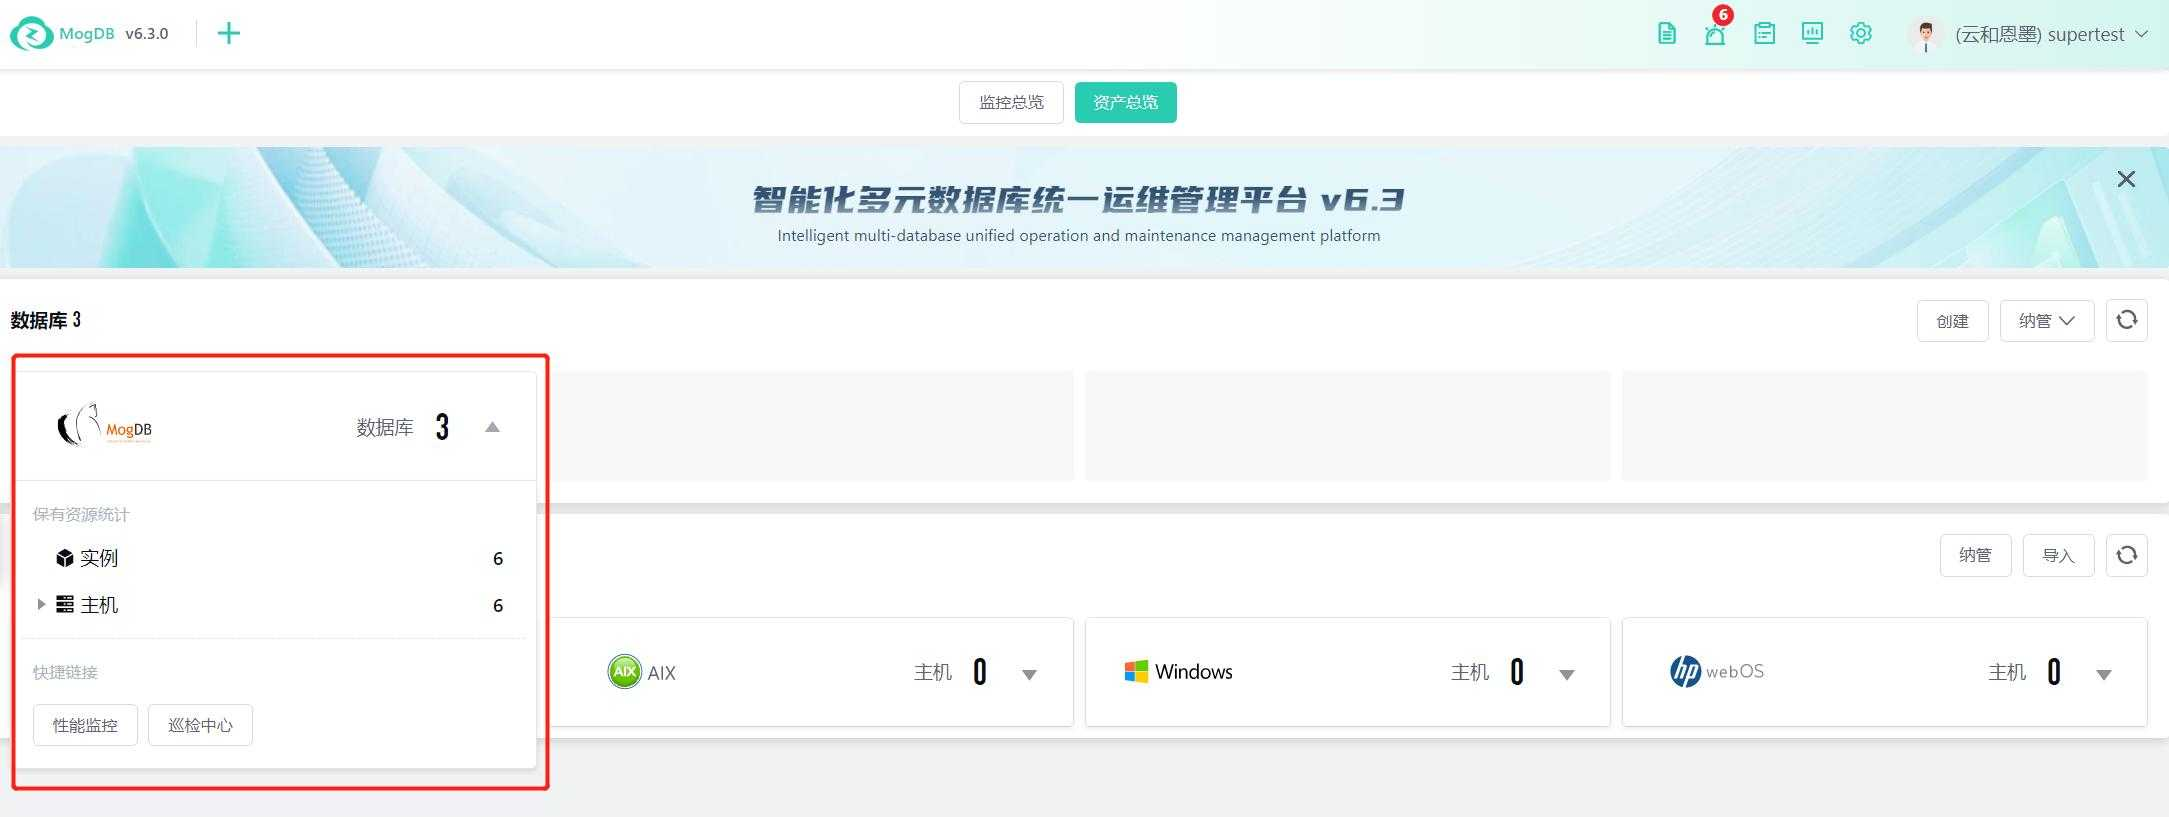
For individual database resources, when hovering, the top icon is displayed, supporting manual pinning to the main panel for display;
Click on the corresponding host resource pool statistics item to jump to the details of the corresponding host resource pool;
Click the quick link to quickly jump to the corresponding functional page;
The host type panel supports expanding details on hover, and clicking the corresponding resource jumps to the host list page, where the status after filtering by this type is displayed;
For individual host resources, when hovering, the top icon is displayed, supporting manual pinning to the main panel for display.