- About
- Basic Features
- Introduction
- Platform Tenant Management
- Platform User Management
- TOTP Certification
- Basic Data Definition
- Media Management
- Command Management
- Mail Server Configuration
- Job Center
- Platform Host Resource Pool
- Platform Database Pool
- Platform Proxy Nodes Management
- Platform Components Management
- Additional Information Management
- Operation Log
- Connection Concurrency Configuration
- Customization of Platform Styles
- Parameter Templates
- License
- Monitor Large Screen
- Overview Display
- Tenant User Management
- Tenant Host Resource Pool
- Tenant Proxy Nodes Management
- Menu Management
- Report Center
- MogDB/openGauss
- Backup Recovery Center
- Monitoring
- Alert Center
- Inspect Center
Session Blocking Analysis
Function Entrance
MogDB/openGauss --> Performance Monitoring --> Instance --> Session Block Analysis
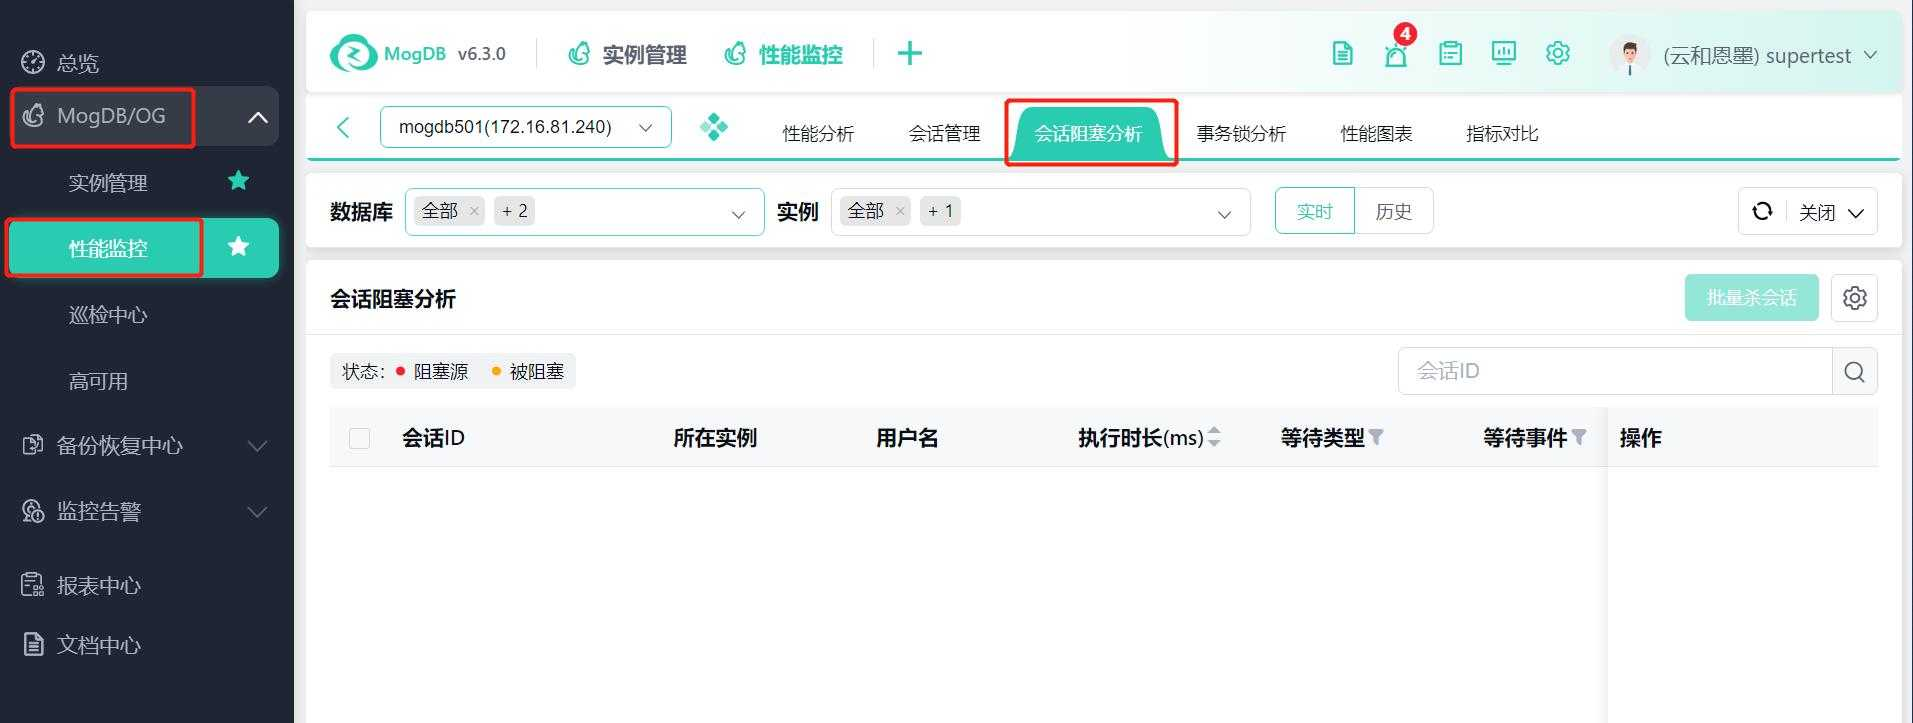
Function Description
Session block analysis: Detailed analysis of the session block chain.
Operating Instructions
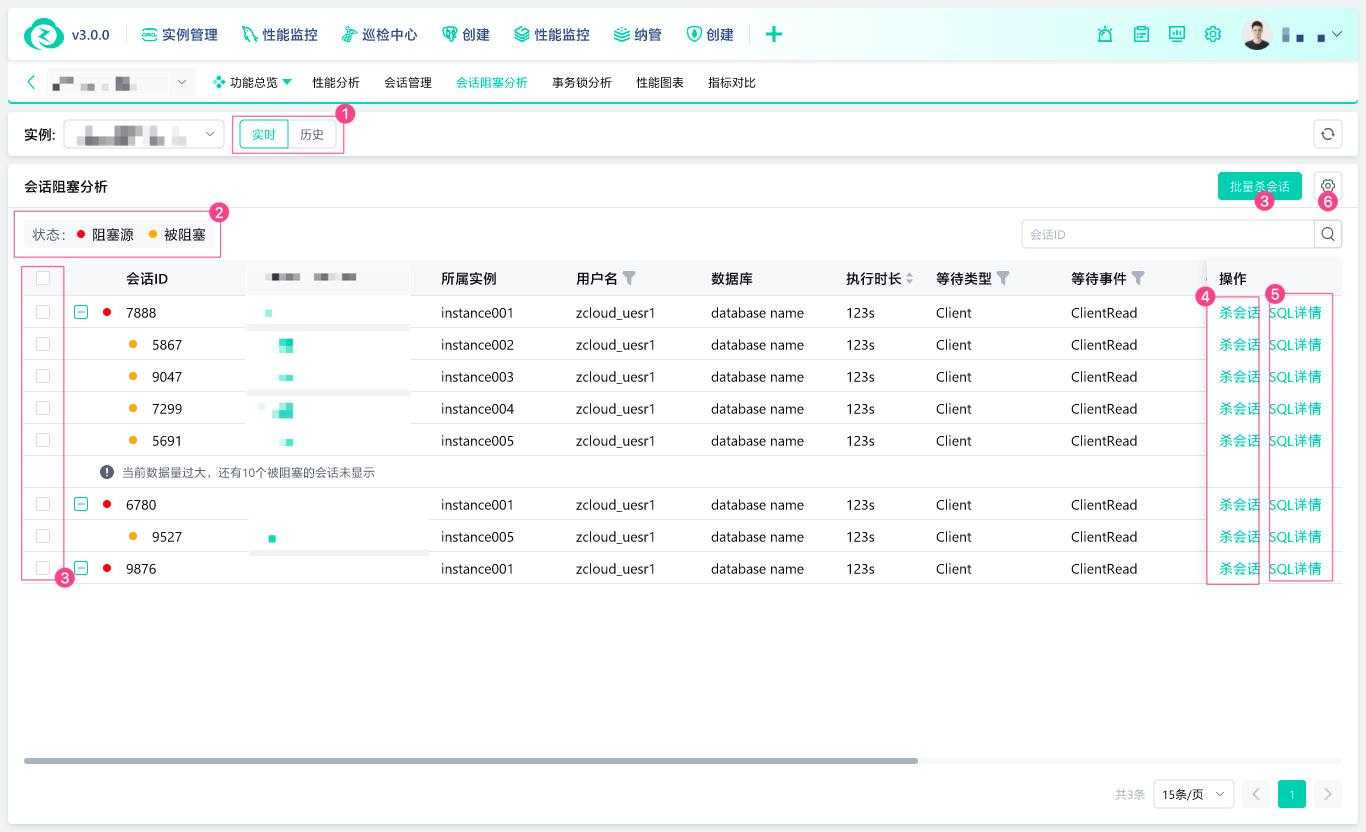
Session Block Analysis (Real-time)
① Switch between real-time and historical pages for session block analysis by clicking the History button.
② Block status legend: Red dots in the list represent session block sources, and yellow dots represent blocked sessions.
③ After selecting multiple sessions in the list, the batch kill session button becomes active. Click the Batch Kill Sessions button to display the batch kill session confirmation popup. Click Confirm to delete the selected sessions in batch.
④ Click the Kill Session button in the list operations column to display the kill session confirmation popup. Click Confirm to terminate a single session.
⑤ Click the SQL Details button in the list operations column, and a new browser tab will open and redirect to the SQL details page.
⑥ Click the gear icon button to display the custom list item popup, where you can configure the default display of field columns in the list.
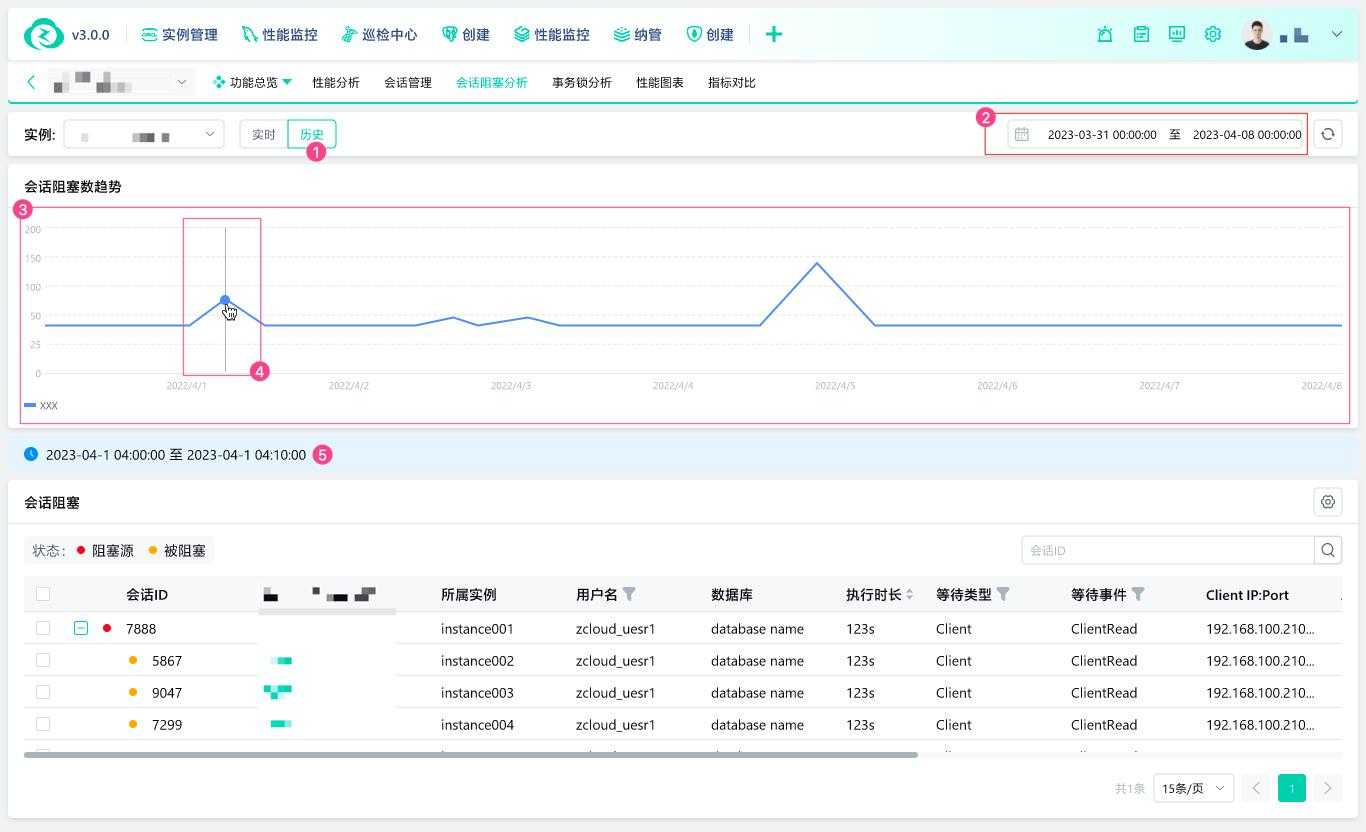
Session Block Analysis (Historical)
① Click the History tab button to switch to the session block analysis historical page.
② Use the time selector to choose the time range for viewing session block trends and historical session blocks.
③ Session block trend chart: Displays a line chart of the number of session blocks within the selected time range. The chart supports clicking to select time nodes.
④ Click on the data fluctuation area in the line chart to view the session block details within that area. The session block details are displayed in the list below.
⑤ Display the time range information of the selected node in the chart.