- About
- Basic Features
- Introduction
- Platform Tenant Management
- Platform User Management
- TOTP Certification
- Basic Data Definition
- Media Management
- Command Management
- Mail Server Configuration
- Job Center
- Platform Host Resource Pool
- Platform Database Pool
- Platform Proxy Nodes Management
- Platform Components Management
- Additional Information Management
- Operation Log
- Connection Concurrency Configuration
- Customization of Platform Styles
- Parameter Templates
- License
- Monitor Large Screen
- Overview Display
- Tenant User Management
- Tenant Host Resource Pool
- Tenant Proxy Nodes Management
- Menu Management
- Report Center
- MogDB/openGauss
- Backup Recovery Center
- Monitoring
- Alert Center
- Inspect Center
Monitor Large Screen
Function Entrance
Tenant user logs in --> Top navigation bar --> Monitoring Dashboard

Function Description
The monitoring dashboard allows for real-time monitoring of databases, providing a unified visual display of platform databases from business perspectives and database types, facilitating quick reviews of key indicators.
For routine monitoring and night shifts, the monitoring dashboard is an important entry point for detecting issues.
Database types supported:
openGauss/MogDB
Monitoring dashboard features include:
- Support for monitoring key indicators of databases across the entire network or within a custom range;
- Support for receiving active alerts and alert voice broadcasts;
- Support for rotating views of database topology, latency, traffic, direction, and other key information;
- Support for rotating views of key performance metrics and memory status of databases.
Operating Instructions
Page Layout
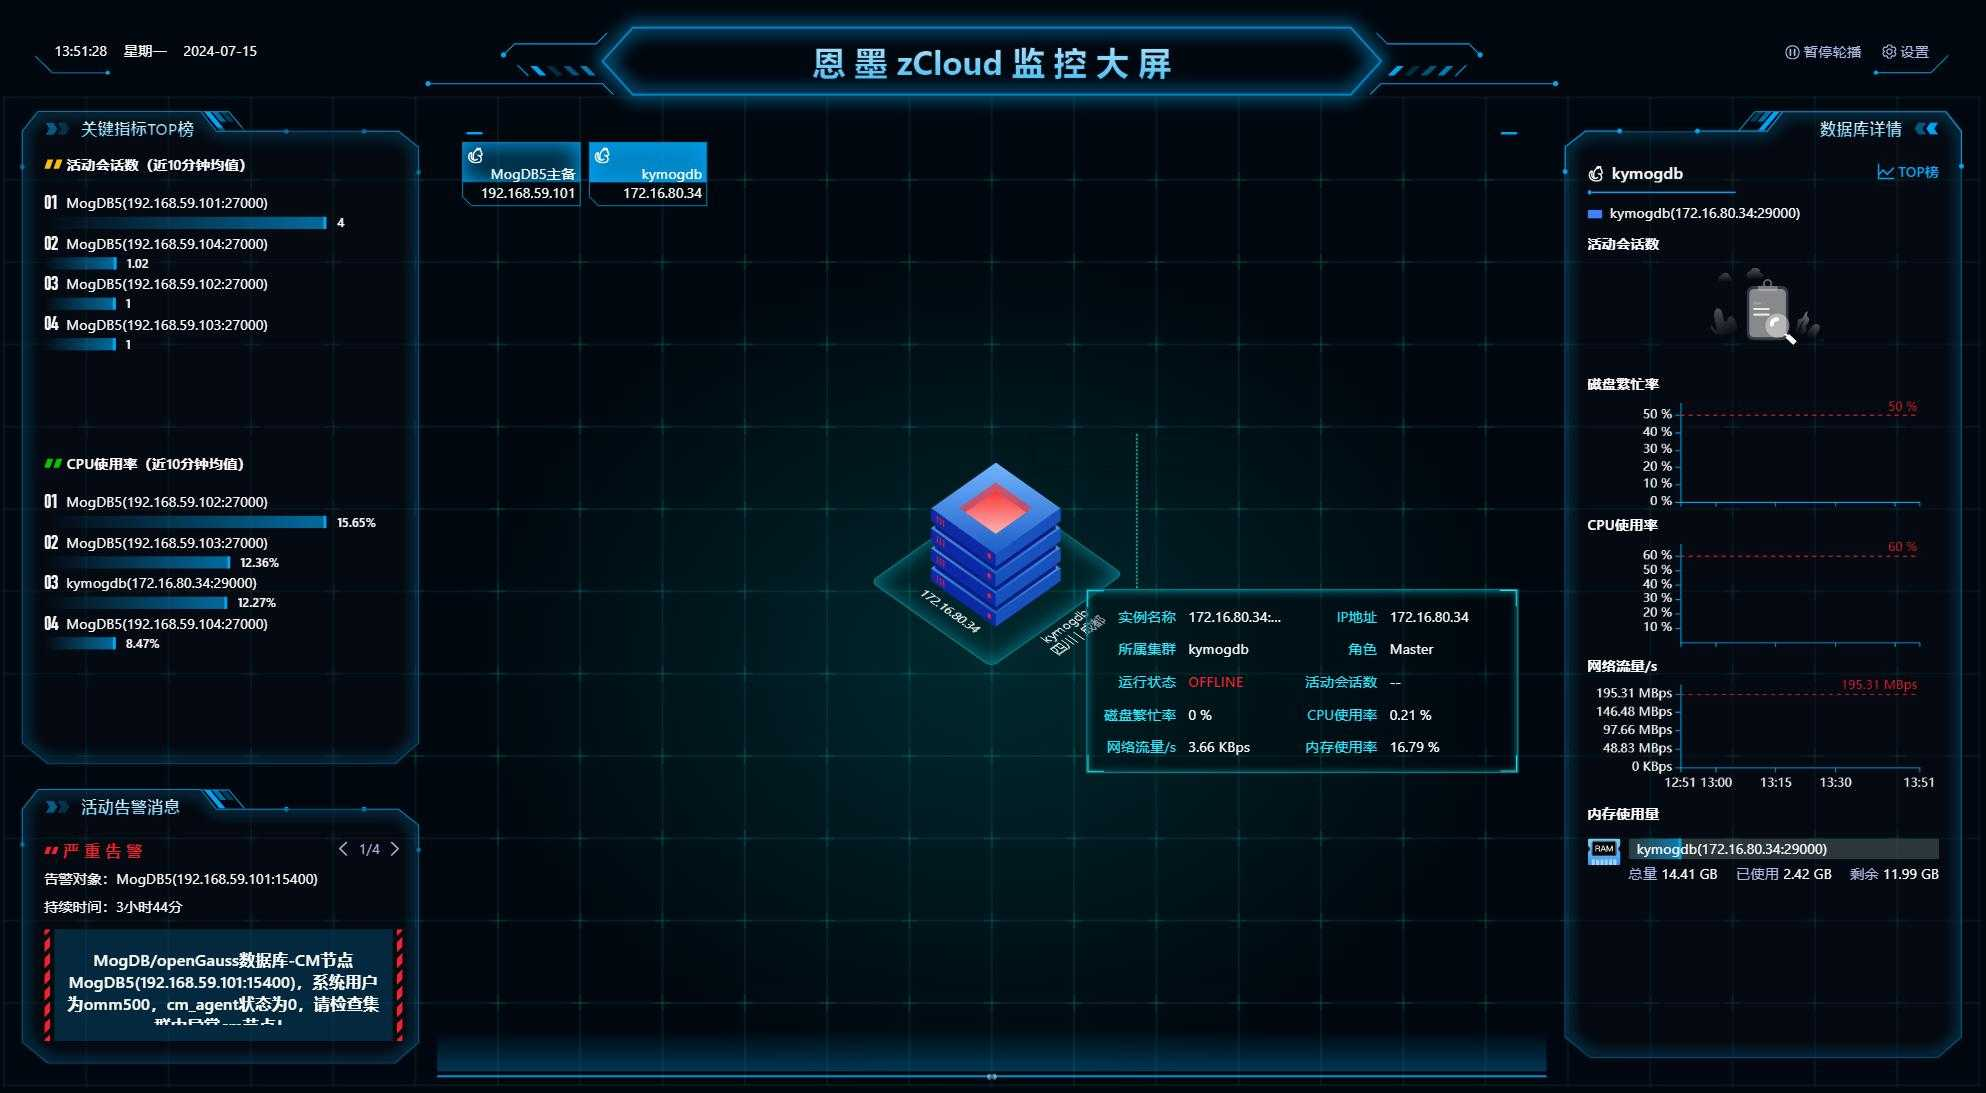
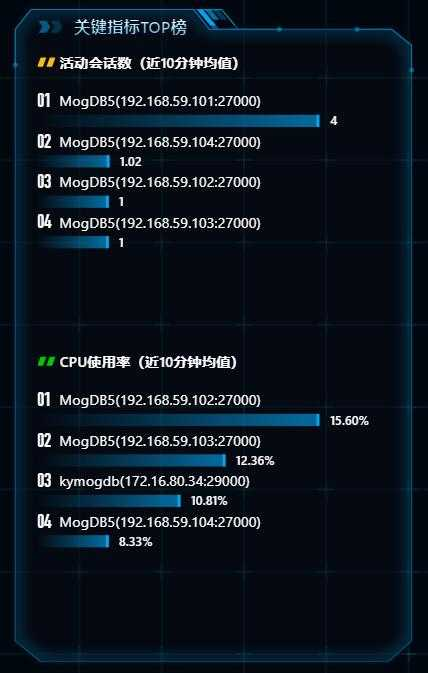
Key Indicator TOP List
-
The indicator ranking for all databases within the monitoring scope, with databases identified by their Chinese names (IPs);
-
Key indicators default to:
- CPU usage rate
- Memory usage rate
- Disk usage rate
- Active session count
-
Users can customize key indicators by going to the page's [Settings] - [Display Settings];
-
The key indicator TOP list displays up to 2 indicators per page and regularly rotates to other indicators, or you can quickly switch by clicking on the title;
-
Users can customize the TOP list's statistical range through the page's [Settings] - [Monitoring Settings], supporting settings for TOP10, TOP20, TOP50;
-
Clicking on an individual database in the TOP list directly switches to the corresponding database to view topology and detailed information;
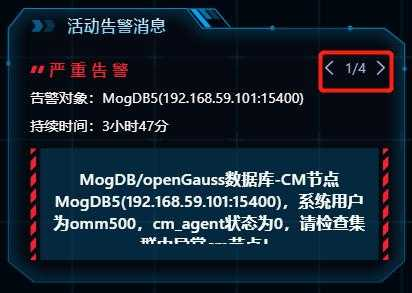
Active Alert Messages
-
Displays current active alert messages, filtering out alerts that are ignored or related to host types;
-
Active alert messages rotate regularly to the next alert, or you can quickly switch by clicking the arrow in the upper right corner;
-
Users can customize alert voice broadcasts through the page's [Settings] - [Monitoring Settings], which will play voice messages immediately when new alerts arrive.
Rotating Databases

-
Displays the currently rotating database, following a left-to-right order;
-
Each card shows the database type icon, Chinese name, IP;
-
You can quickly switch databases by clicking on individual cards or by clicking the arrows on either side to switch to the next page;
-
The rotation includes databases from the key indicator TOP list, alerted databases, and databases manually followed by users;
-
The rotation order is: followed databases > alerted databases > TOP list triggered thresholds > TOP list untriggered thresholds, and the page will re-sort according to this order after each data refresh;
-
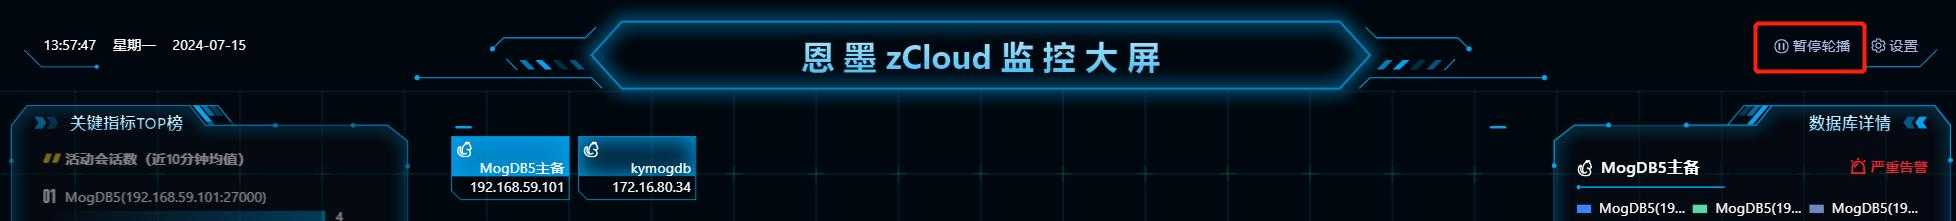
When users want to continuously monitor a specific database, they can click the [Pause Rotation] button in the upper right corner of the page. After pausing, the page data will refresh, but the rotation will not automatically switch to the next database set, and the currently viewed database will remain within the rotation range.
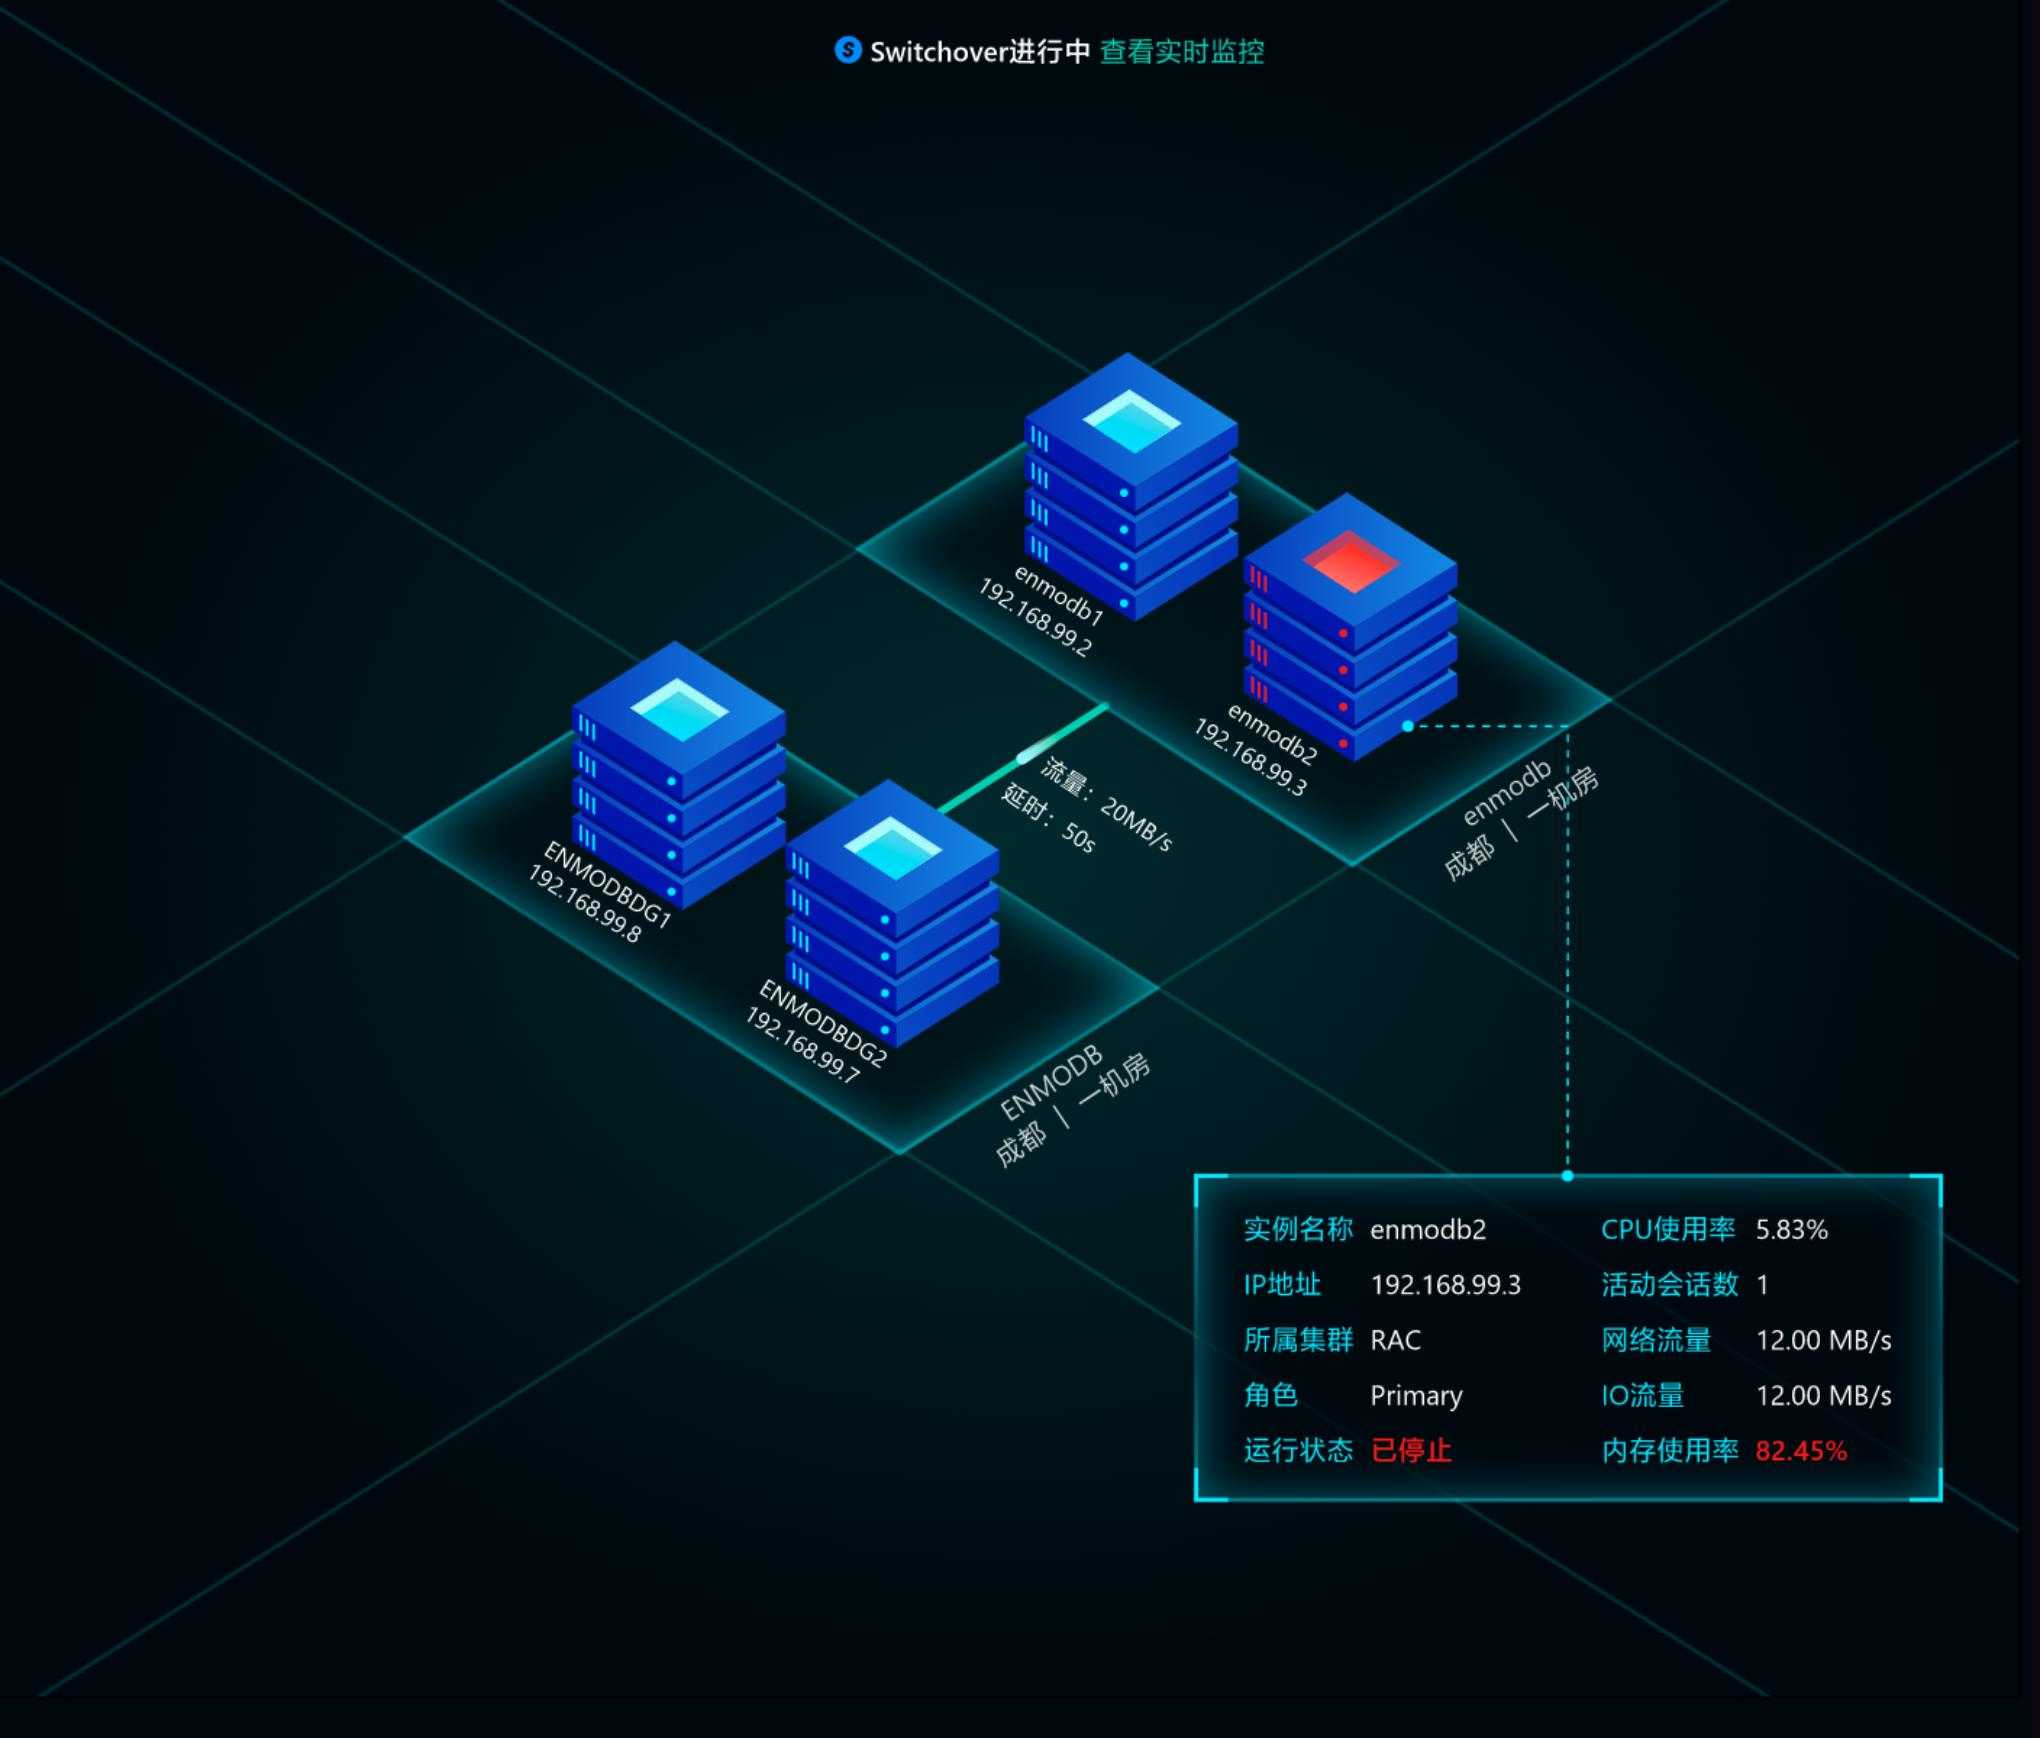
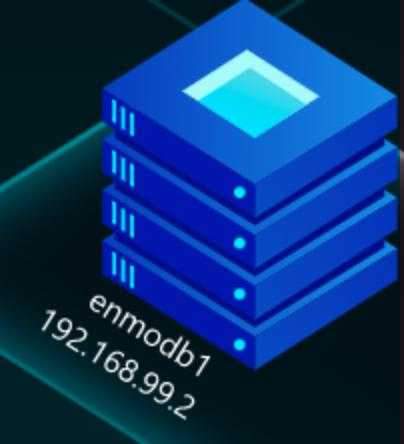
Database Details - Topology Diagram
-
Displays the topology diagram of the currently rotating database;
-
Each icon represents an instance or node, showing the name and IP of each node;
-
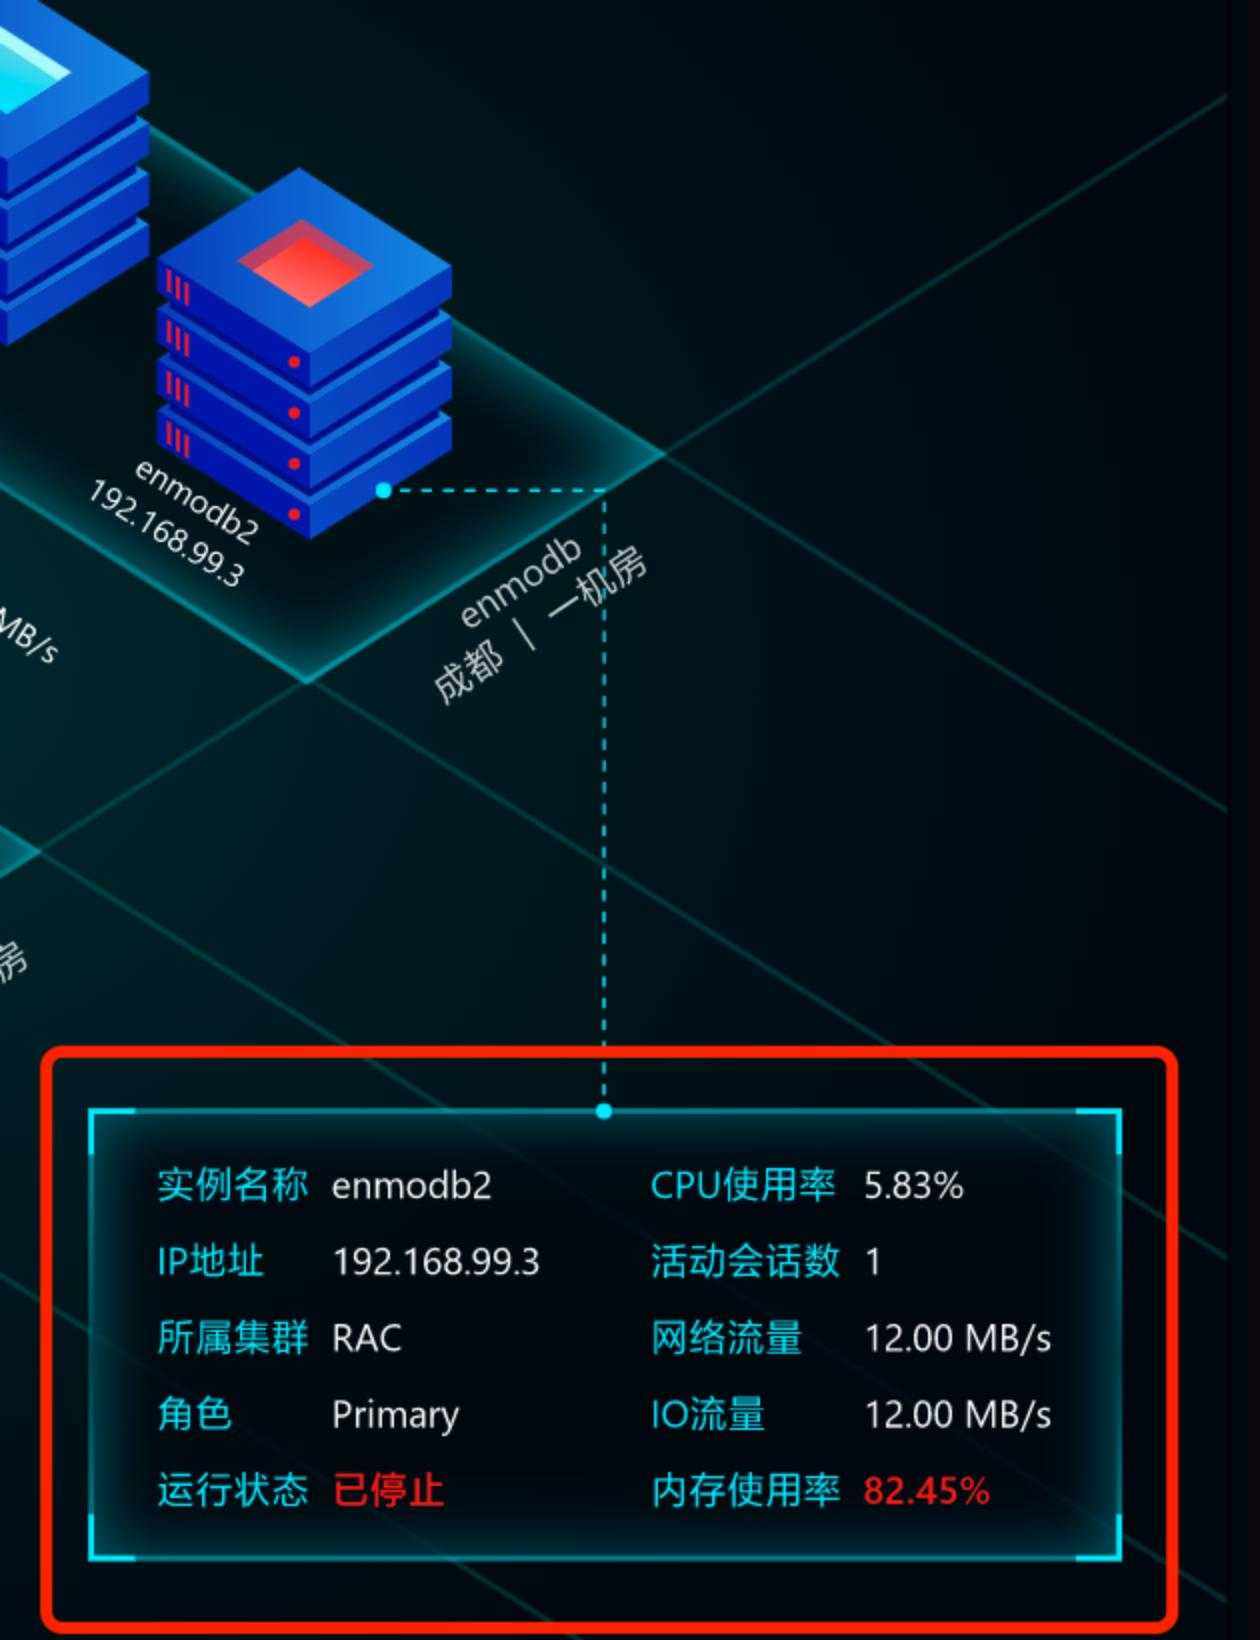
When a node's operational status is stopped, the icon turns red, and when database metrics exceed thresholds, the icon turns yellow;
-
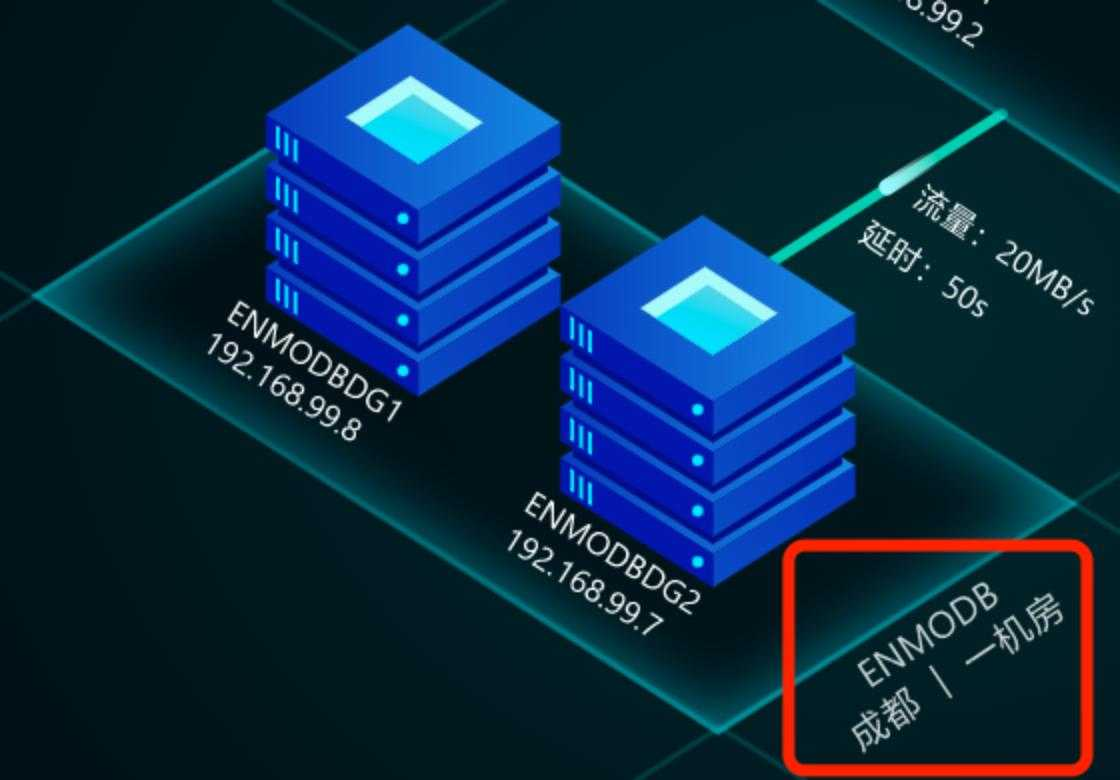
Each base frame represents a group, showing the name, region, and machine room;
-
The connections between groups show the data flow, traffic, and latency between primary and secondary databases;
-
Clicking on an individual node displays detailed information for that node, with detail fields consistent with the details shown in the right-side chart. You can configure this through [Settings] - [Display Settings];
-
Prioritize displaying stopped or threshold-exceeded nodes; when multiple nodes are abnormal or no anomalies exist, prioritize displaying nodes higher in the hierarchy (upper right of the page).
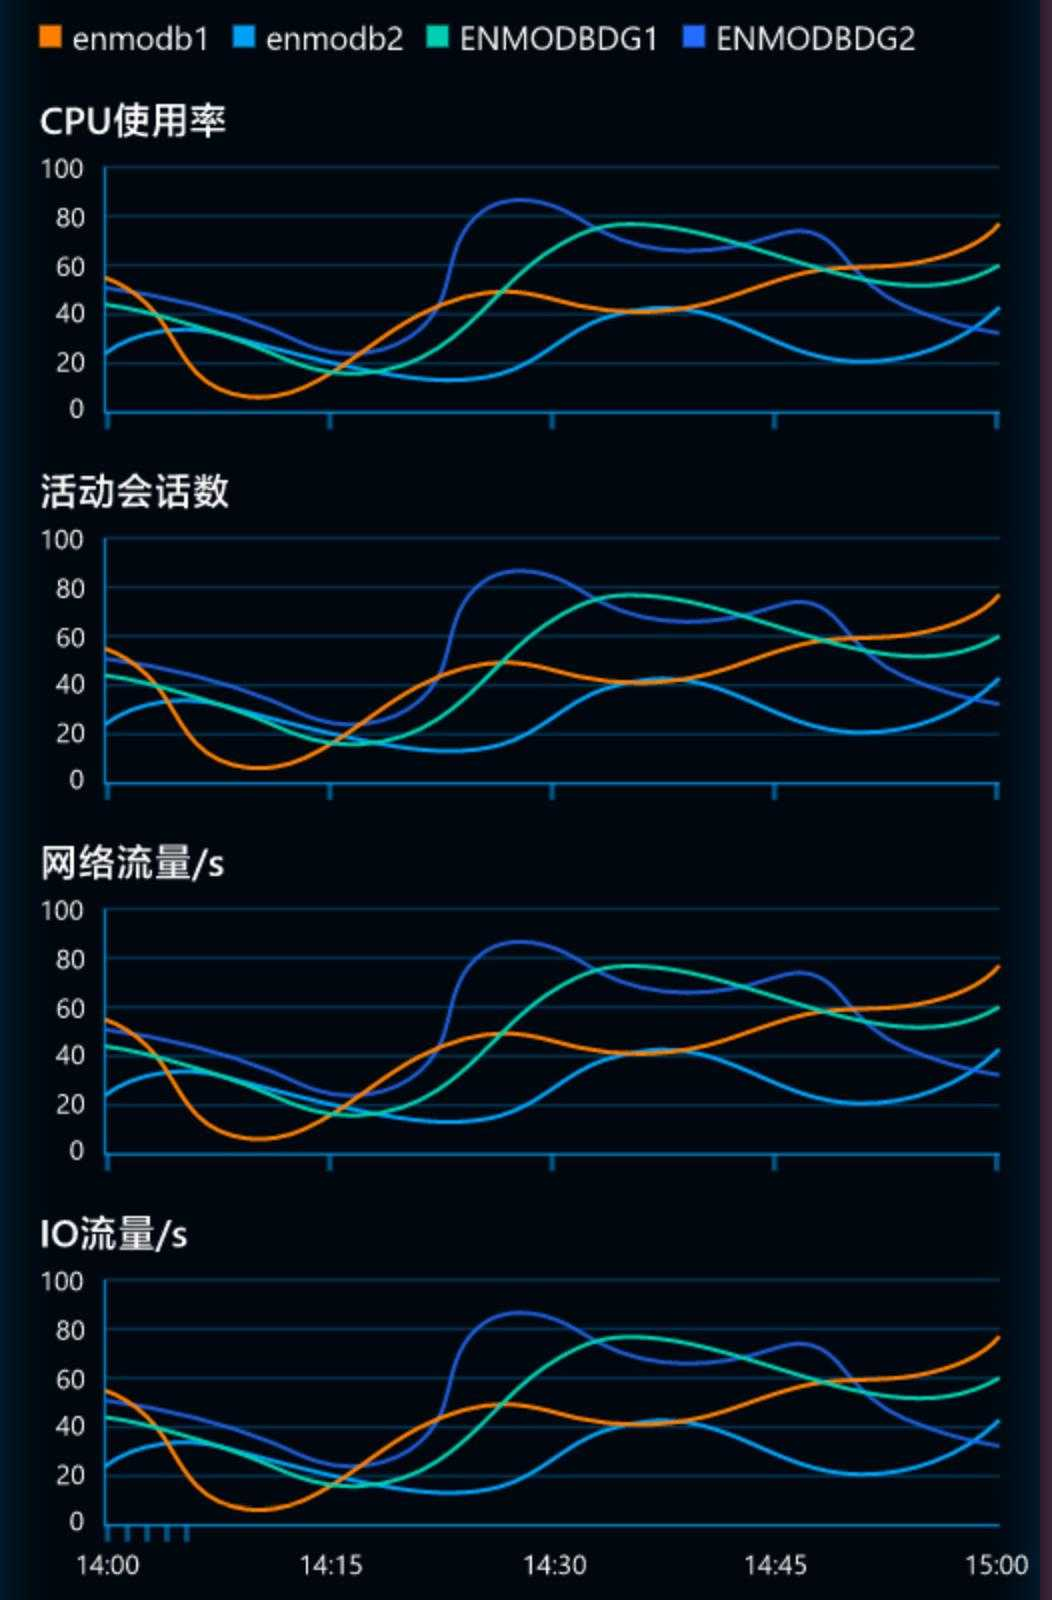
Database Details - Right-Side Charts
-
The right side displays detailed information for the currently rotating database;

-
Displays the rotation reason for the current database, including: severe alerts - warning alerts - followed - TOP list;
-
Displays the last hour's instance details for the current database, defaulting to:
- CPU usage rate
- Active session count
- Network traffic/s
- IO traffic/s
-
Users can customize detail metrics through the page's [Settings] - [Display Settings];
-
Detail metrics display up to 4 indicators per page and regularly rotate to other indicators, or you can quickly switch by clicking on the title;
-
When a database has multiple instances, detail metrics will display up to 5 instances at most;
-
Displays the memory status of the current database, defaulting to the following three, with differences based on database type:
- Space usage
- Archive space usage
- Memory usage
Settings
-
Settings entry: Click the [Settings button] in the upper right corner of the page to open the settings pop-up window;

-
Choose dashboard scheme:
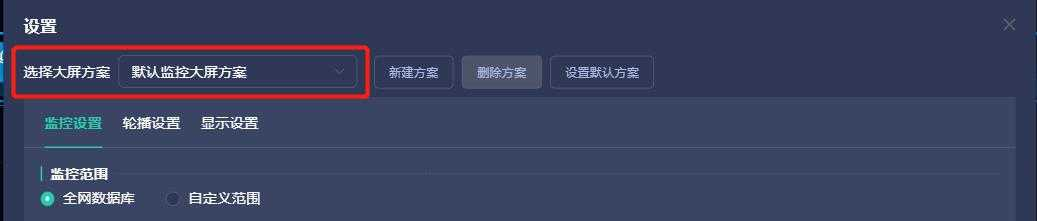
- 2.1 Save the monitoring dashboard's settings as a scheme for quick switching between monitoring schemes. Switching takes effect after clicking [Save];
- 2.2 The default scheme for the monitoring dashboard is "zCloud Monitoring Dashboard." After modifying the scheme, click [Save] to take effect;
- 2.3 Click [New Scheme] to create a new scheme. Enter a name for the new scheme, supporting 5-20 characters, no duplicates;
- 2.4 After setting up the new scheme, click [Save] to create it successfully. Click [Cancel] to abandon the new scheme and select the previous scheme;
- 2.5 Click [Delete Scheme]. There will be a confirmation pop-up. After confirming, the scheme will be deleted. The default scheme's delete button is disabled, and hovering will show "Default scheme cannot be deleted";
- 2.6 Click [Set Default Scheme]. There will be a setting pop-up to set a scheme as the default. Entering the page will prioritize the default scheme;
- 2.7 If users modify and close the pop-up or switch schemes without saving, there will be a pop-up reminder "Current modifications are not saved, do you want to discard the save?";
-
Monitoring settings:
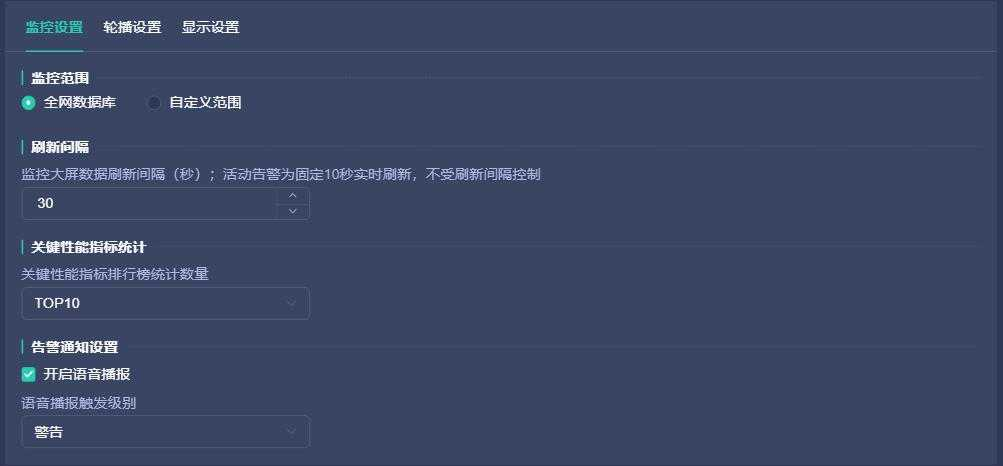
- 3.1 Monitoring scope: The range of databases participating in monitoring, only databases and instances within the scope will be monitored for metrics and alerts;
- 3.2 The default monitoring scope is all network databases, referring to all databases the current user has permission to monitor;
- 3.3 Support for selecting a custom range, allowing users to select databases and instances they want to monitor, supporting quick filtering by project group and role;
- 3.4 Refresh interval: The data refresh interval for the monitoring dashboard, defaulting to 60 seconds, supporting settings from 30 to 3600 seconds. Note that active alert monitoring defaults to a 10-second refresh and is not controlled by the refresh interval;
- 3.5 Key performance indicator statistics: The range for the TOP list statistics on the left side of the page, supporting settings for TOP10, TOP20, TOP50, defaulting to TOP10;
- 3.6 Alert notification settings: When new active alerts occur, voice alert notifications can be triggered;
-
Rotation settings:
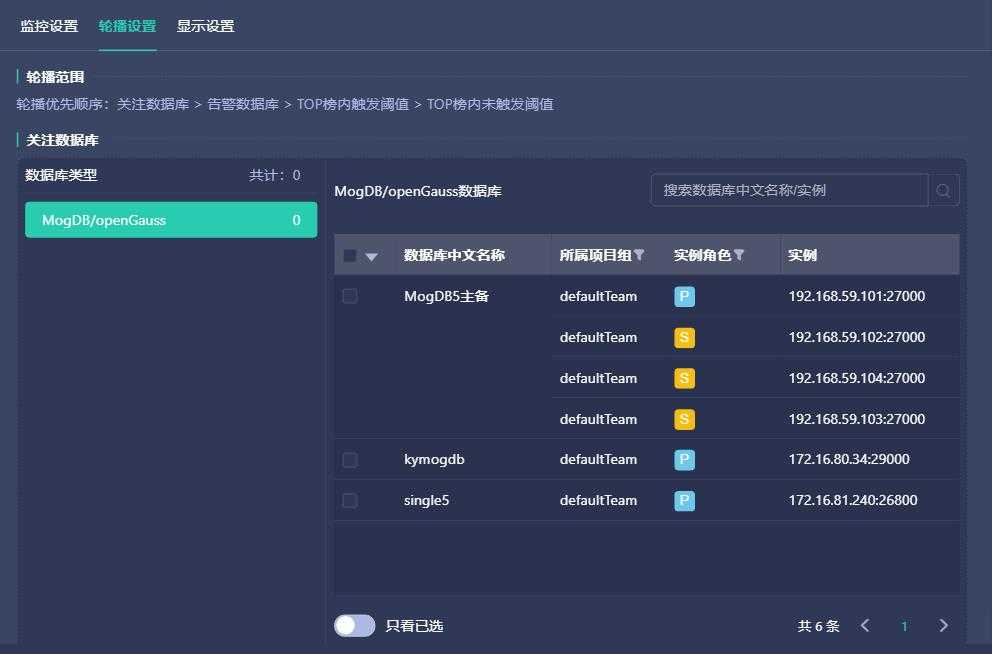
- 4.1 Support for users to add followed databases to participate in rotation, up to 20 databases can be followed;
- 4.2 Following databases only supports selecting databases set to be monitored in "Monitoring Settings";
-
Display settings:
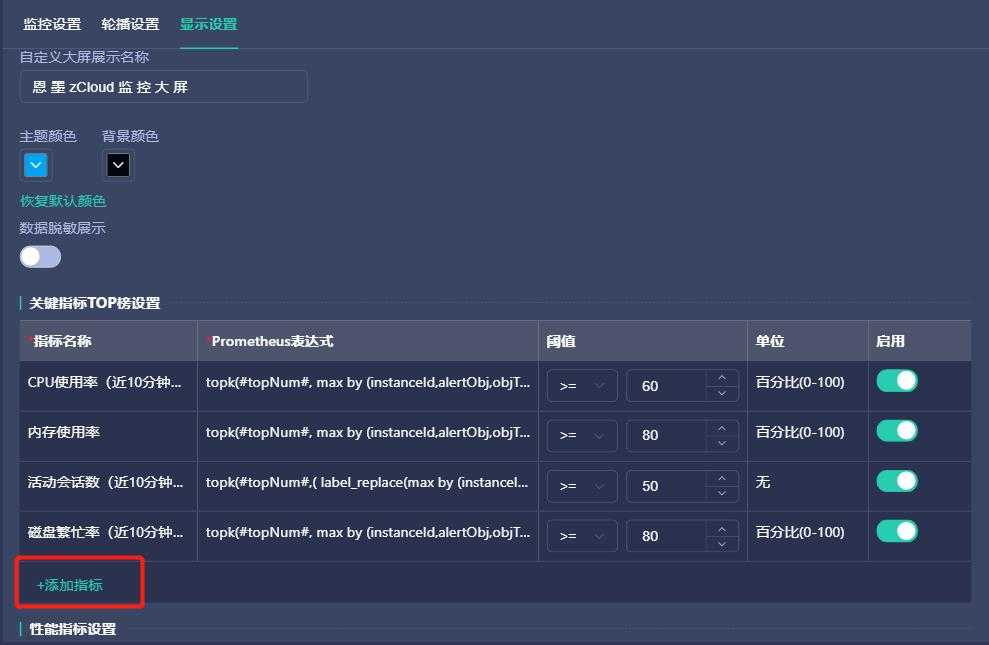
- 5.1 Customize the title of the monitoring dashboard, supporting 5-20 characters;
- 5.2 Customize the theme color of the monitoring dashboard;
- 5.3 Customize the configuration of key indicator TOP lists and database performance indicators. When setting database indicators, distinguish between database types and set them separately by switching databases using the drop-down menu;
- 5.4 Key indicators and indicator indicators have 4 default indicators that cannot be modified in name and expression but can have thresholds and enablement set;
- 5.6 Support for users to add up to 4 custom indicators;
- 5.7 Customize indicator names, supporting 2-16 characters;
- 5.8 Enter Prometheus expressions to obtain the data needed for indicator display, supporting 1-4096 characters;
- 5.9 Set indicator thresholds, which will be marked in red in the corresponding charts when the threshold conditions are met;
- 5.10 Choose whether to enable, disabled indicators will not be displayed on the monitoring dashboard.