- About
- Basic Features
- Introduction
- Platform Tenant Management
- Platform User Management
- TOTP Certification
- Basic Data Definition
- Media Management
- Command Management
- Mail Server Configuration
- Job Center
- Platform Host Resource Pool
- Platform Database Pool
- Platform Proxy Nodes Management
- Platform Components Management
- Additional Information Management
- Operation Log
- Connection Concurrency Configuration
- Customization of Platform Styles
- Parameter Templates
- License
- Monitor Large Screen
- Overview Display
- Tenant User Management
- Tenant Host Resource Pool
- Tenant Proxy Nodes Management
- Menu Management
- Report Center
- MogDB/openGauss
- Backup Recovery Center
- Monitoring
- Alert Center
- Inspect Center
Metrics Comparison
Function Entrance
Left-hand function bar MogDB/OG Database --> Performance Monitoring --> Select MogDB/OG Instance --> Metrics Comparison
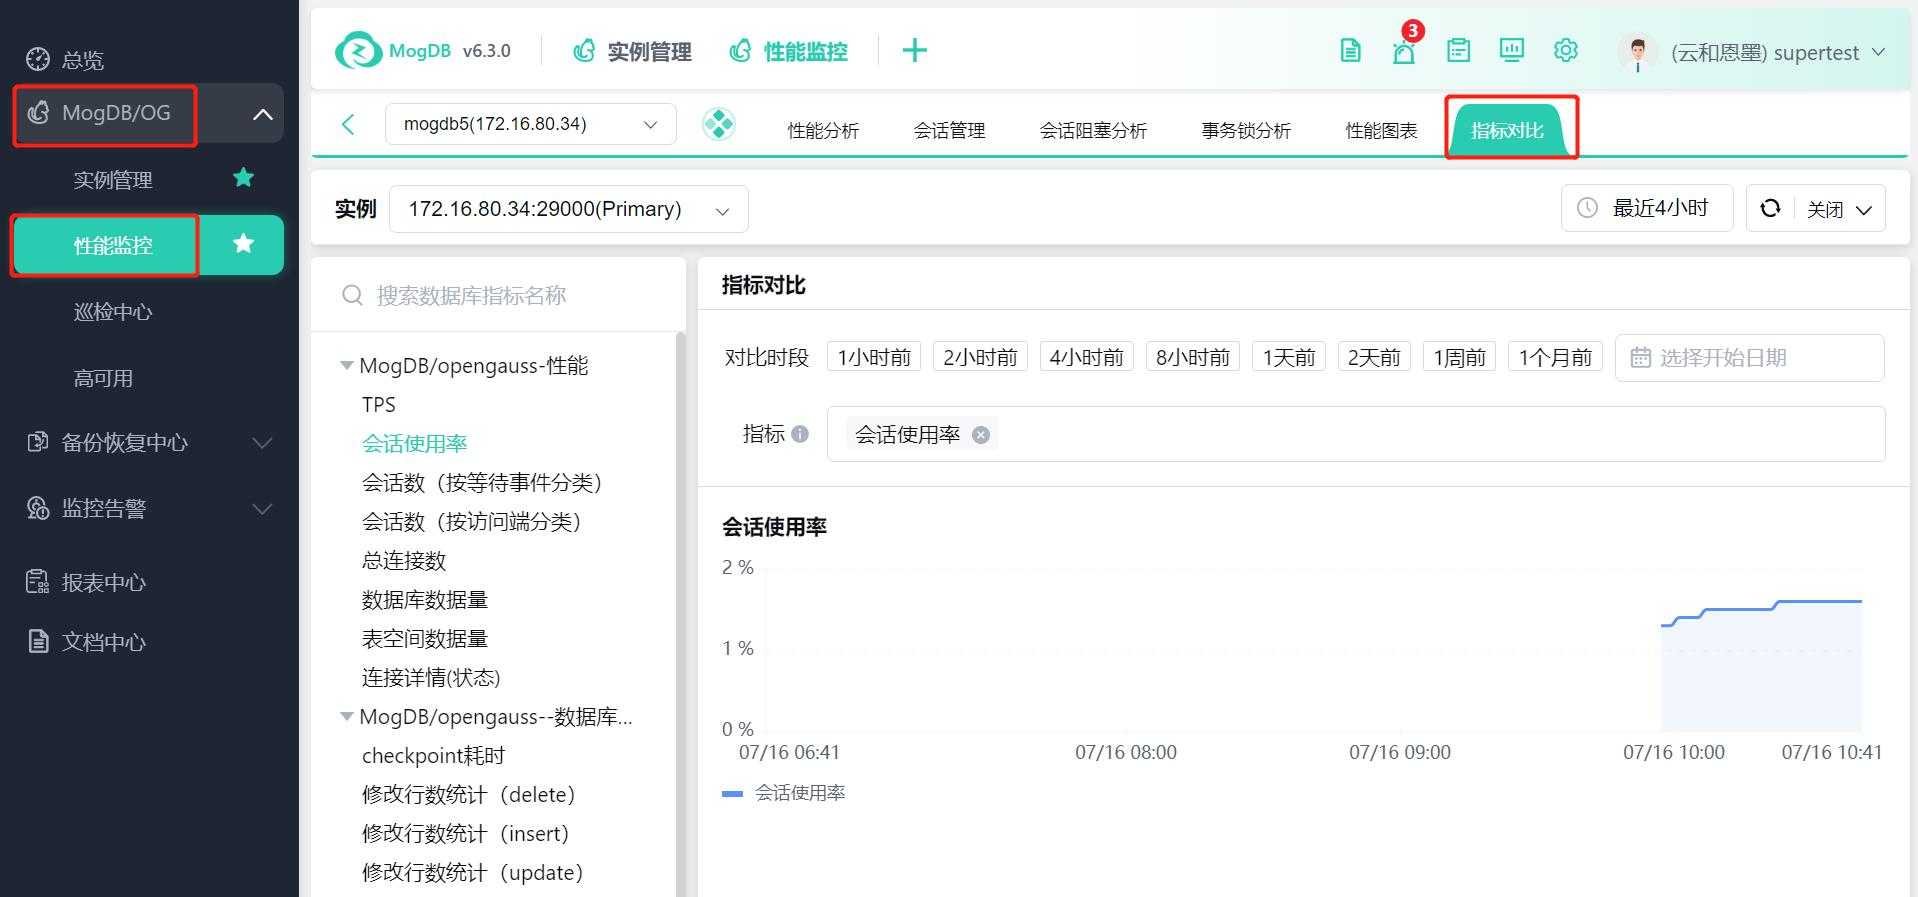
Function Description
Compare historical key performance metrics of MogDB/OG databases.
Note: Metrics related to database hosts without host management are not supported.
Operating Instructions
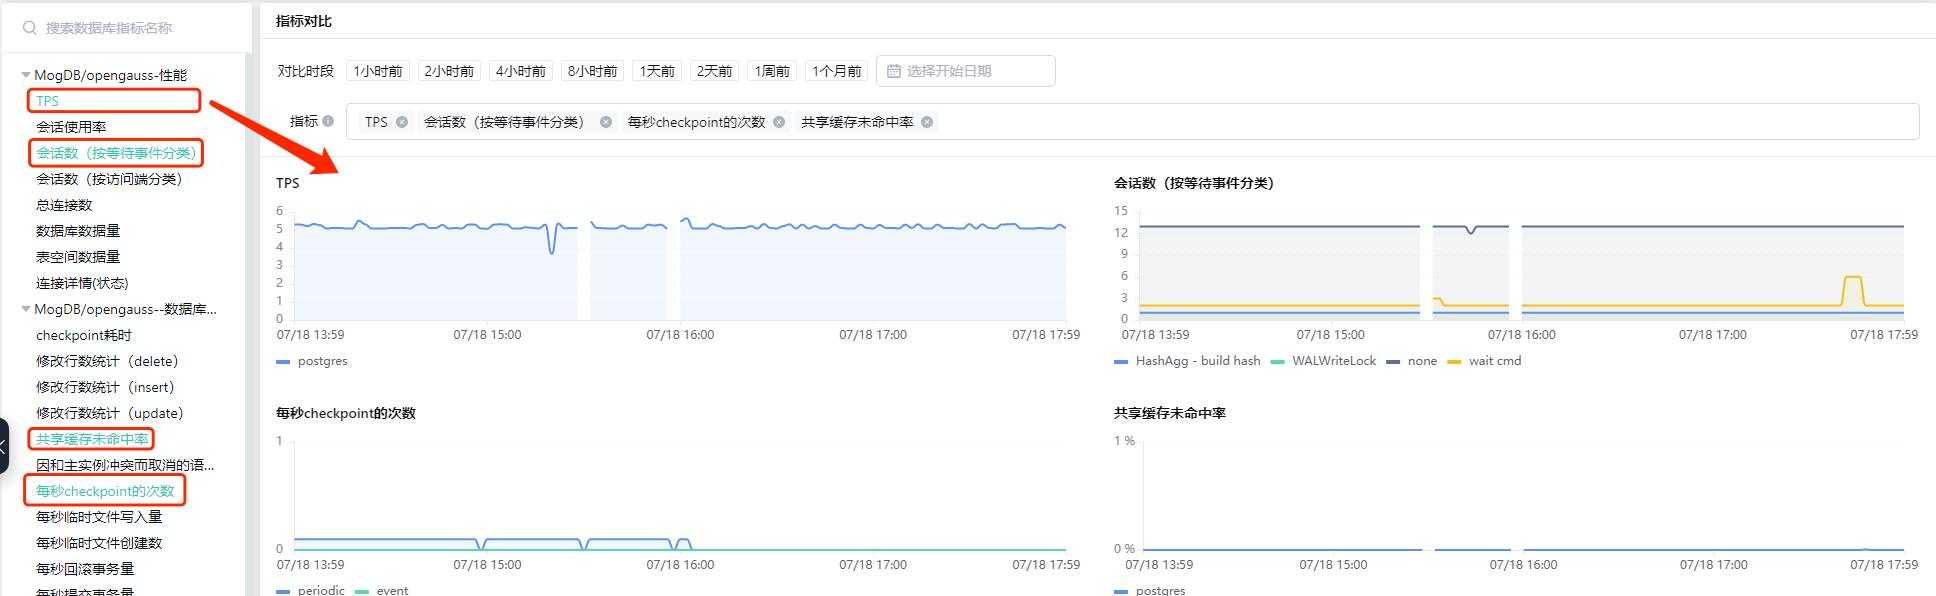
Click on the metric names on the left to select the performance metrics to display, and show the corresponding performance charts (multiple selections are available):
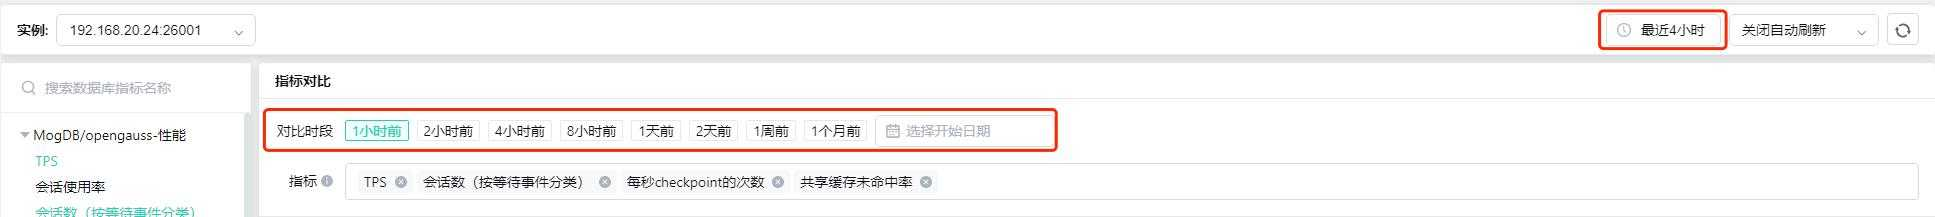
Click to select the comparison time period: 1 hour ago, 2 hours ago... 1 month ago (data is available from the time the database was managed by the platform) Click on the time frame in the upper right corner to select the display time range, default is the latest 4 hours:
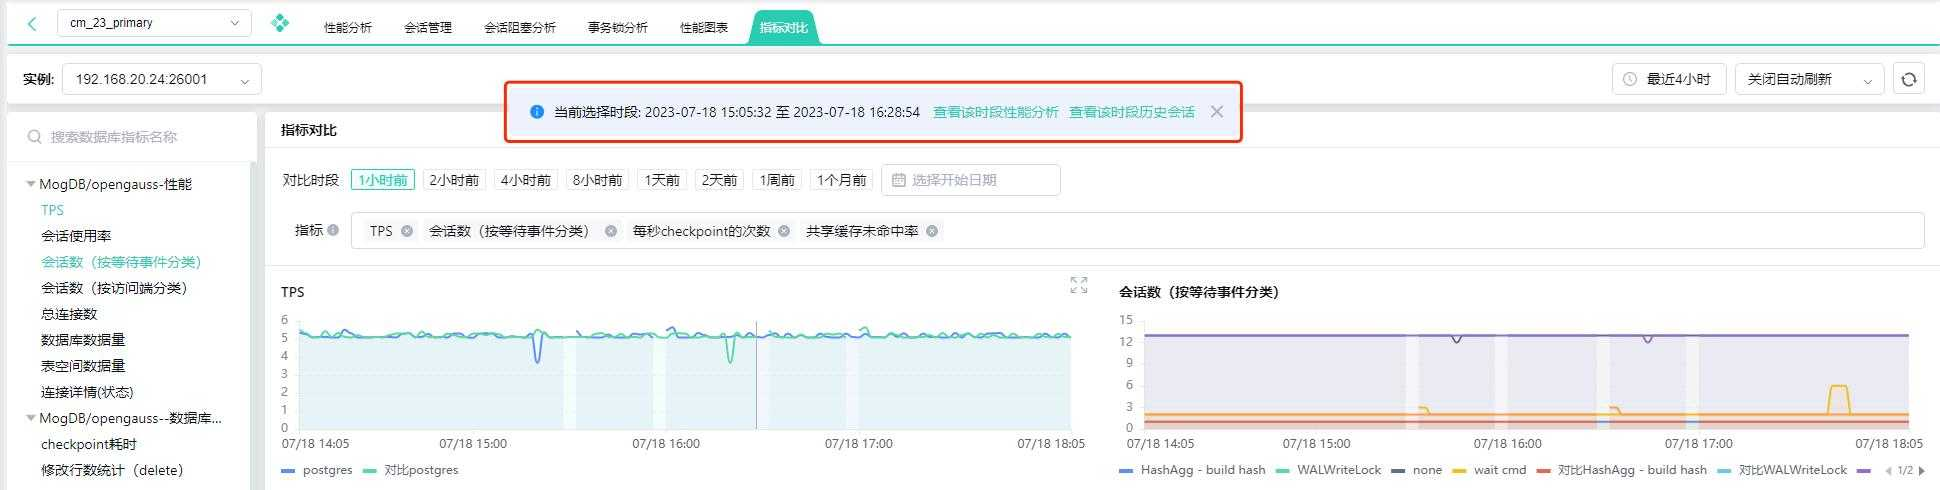
When fluctuations are detected, you can select a time segment and jump to the corresponding time period's performance analysis tab for analysis.