- About
- Basic Features
- Introduction
- Platform Tenant Management
- Platform User Management
- TOTP Certification
- Basic Data Definition
- Media Management
- Command Management
- Mail Server Configuration
- Job Center
- Platform Host Resource Pool
- Platform Database Pool
- Platform Proxy Nodes Management
- Platform Components Management
- Additional Information Management
- Operation Log
- Connection Concurrency Configuration
- Customization of Platform Styles
- Parameter Templates
- License
- Monitor Large Screen
- Overview Display
- Tenant User Management
- Tenant Host Resource Pool
- Tenant Proxy Nodes Management
- Menu Management
- Report Center
- MogDB/openGauss
- Backup Recovery Center
- Monitoring
- Alert Center
- Inspect Center
Dashboard Management
Function Entrance
Left-hand function bar --> Monitoring & Alerts --> Dashboard Management
Function Description
Display and modify all available dashboard configurations for the tenant.
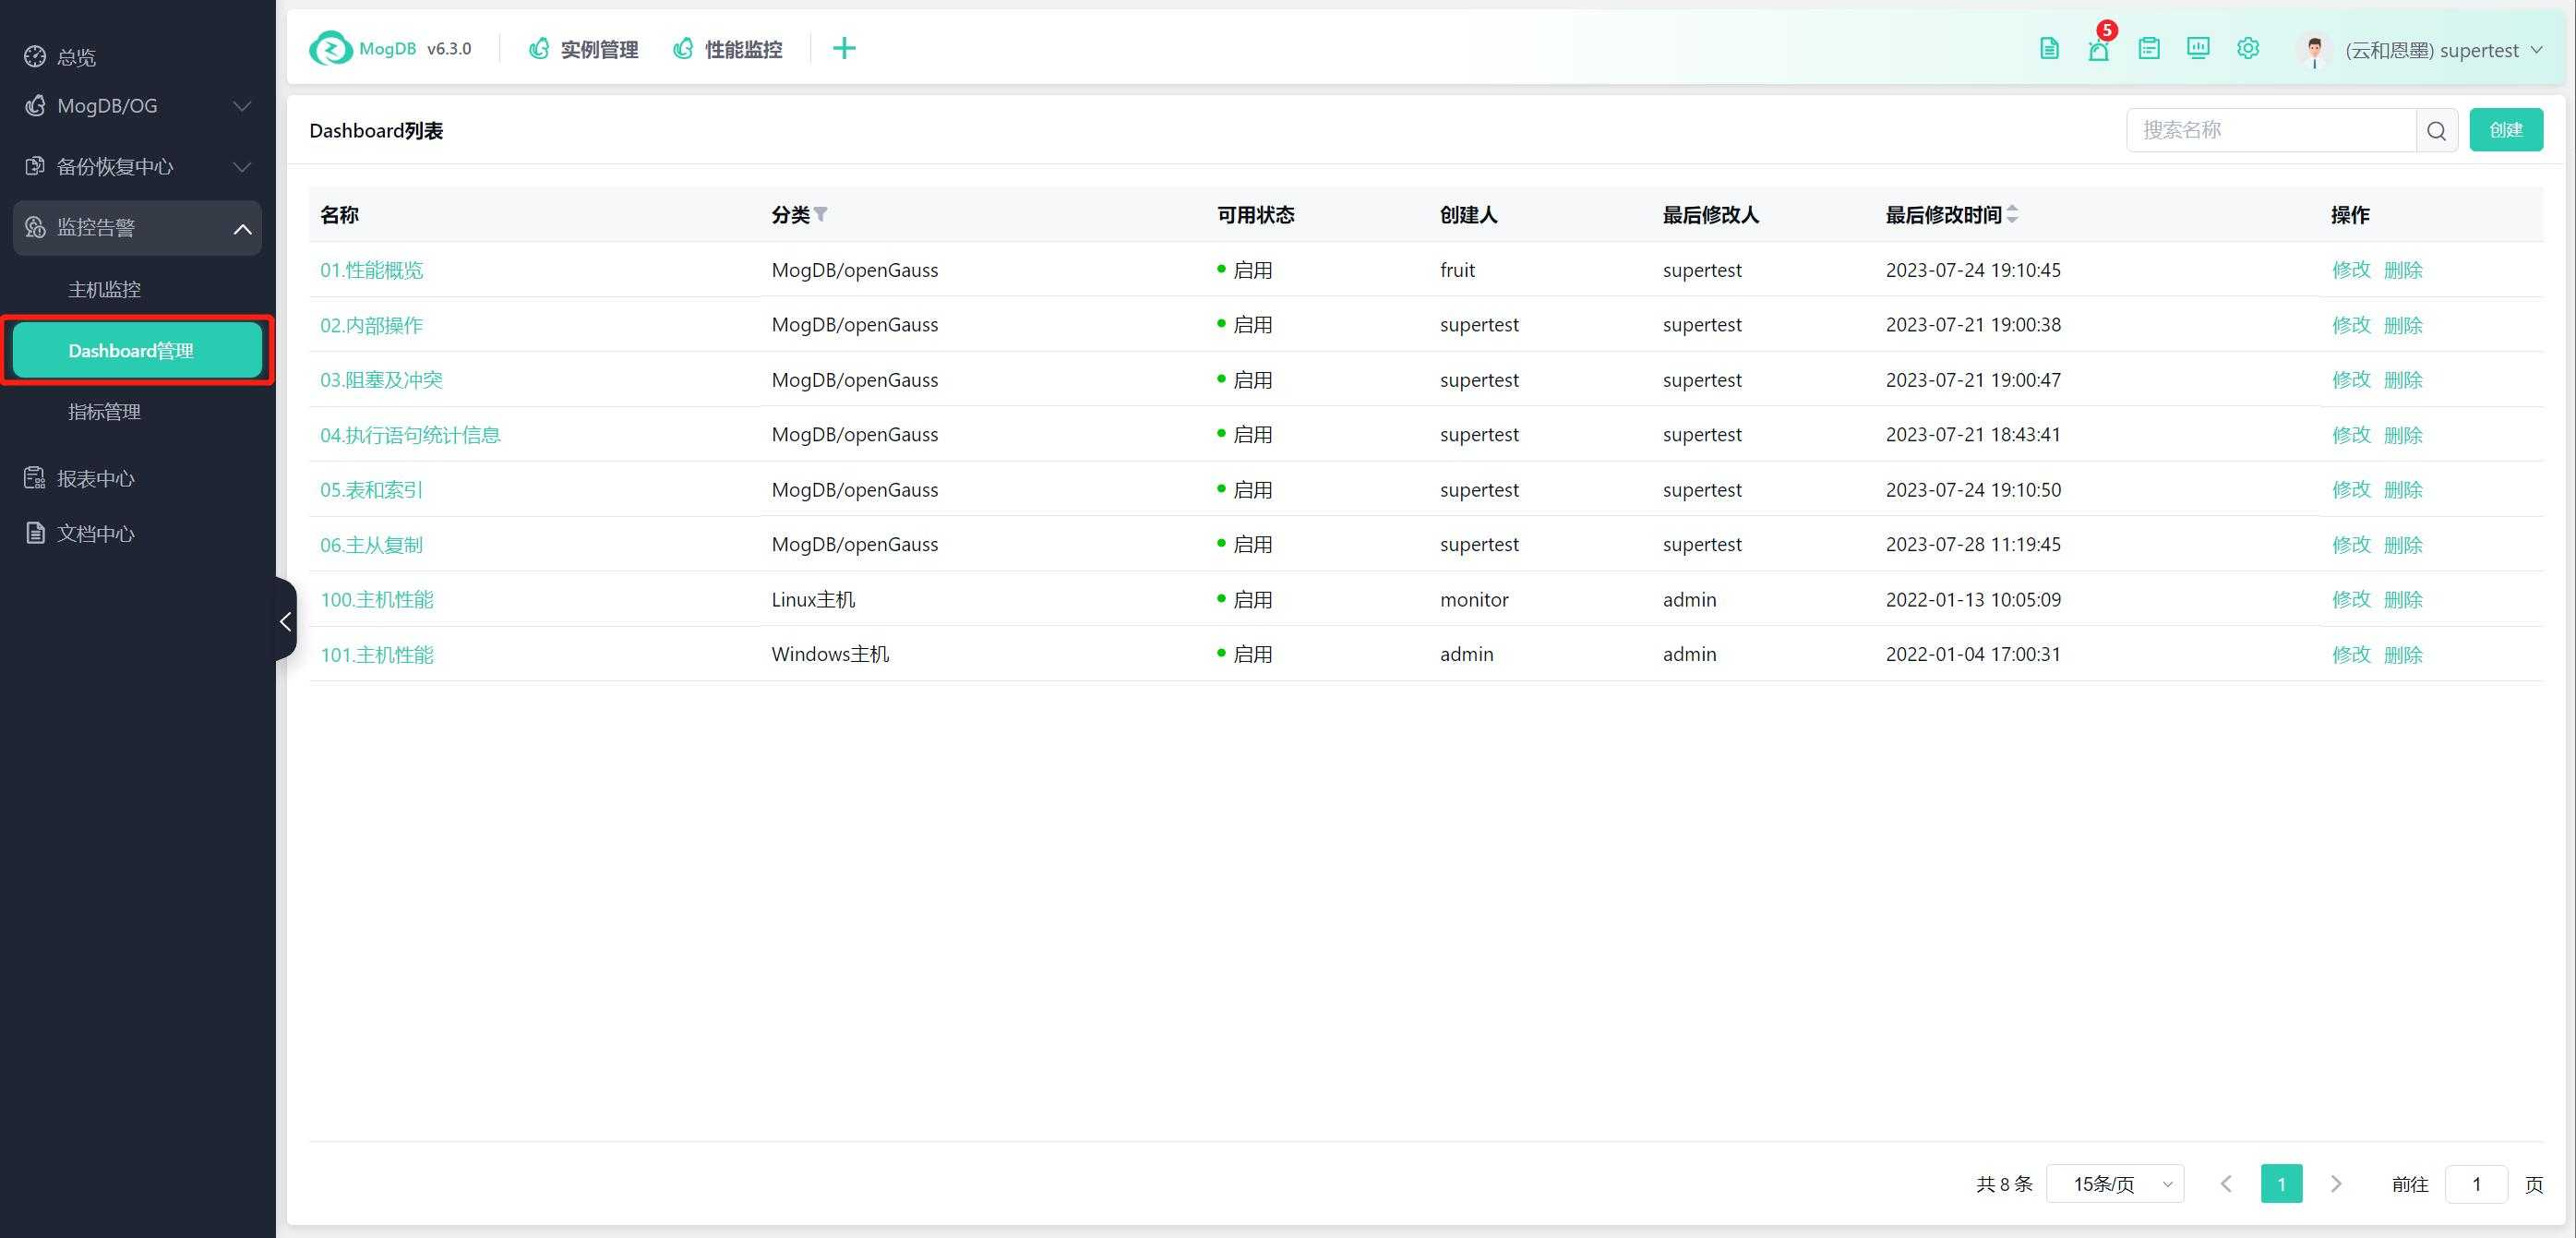
Operating Instructions
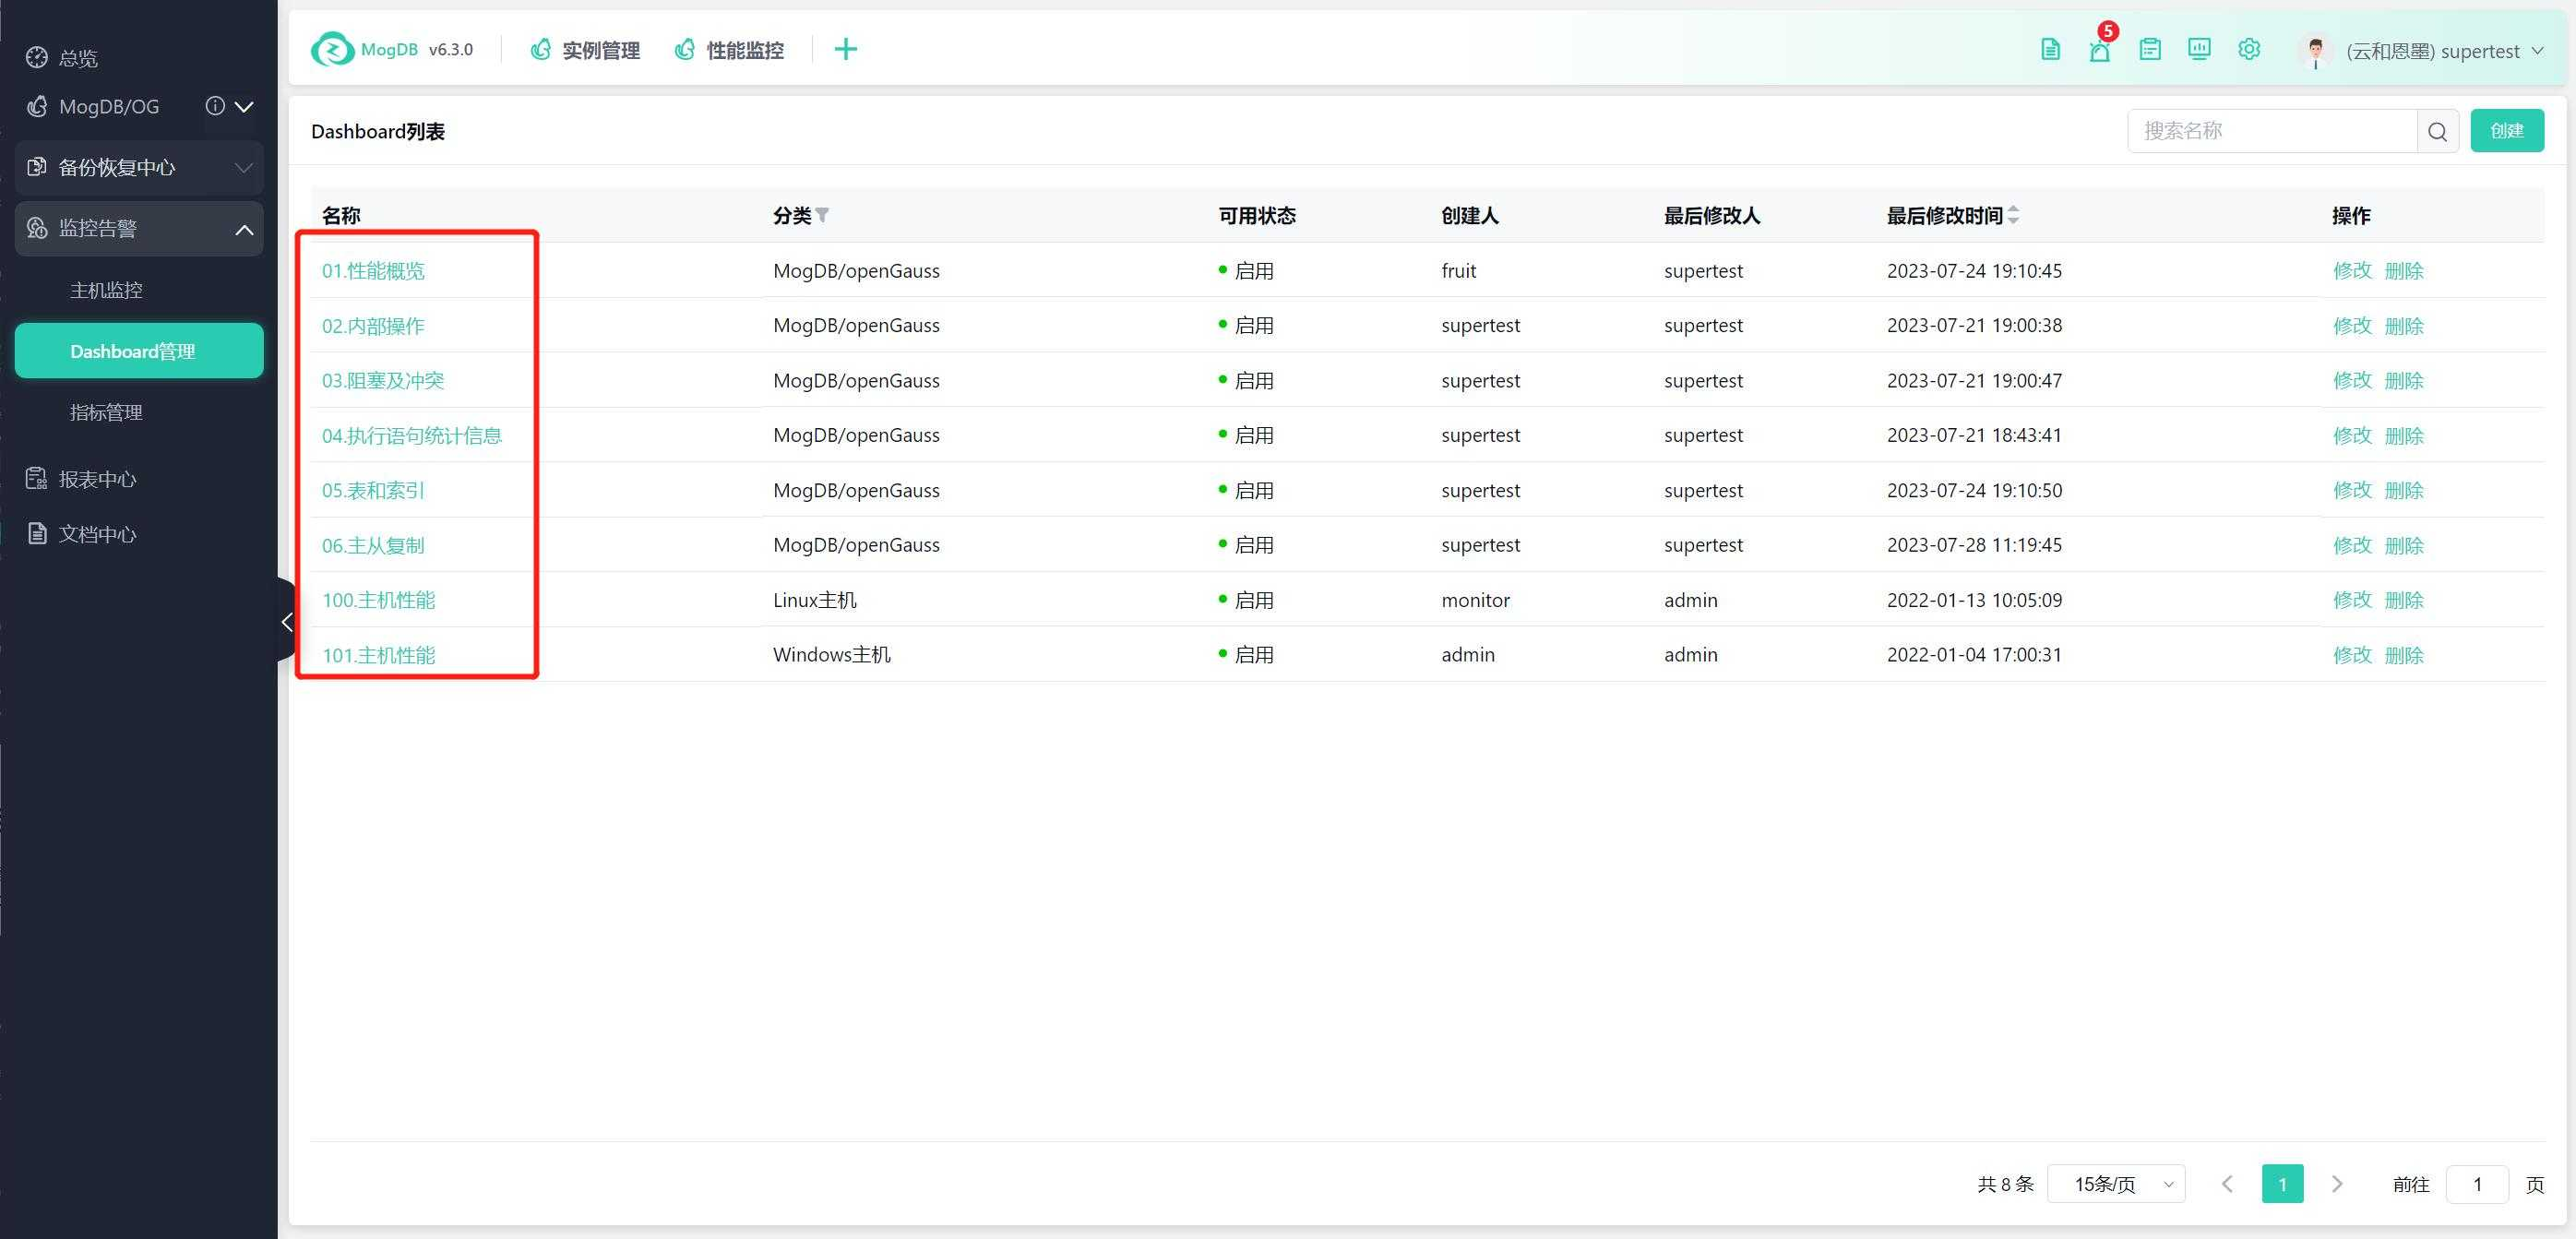
List
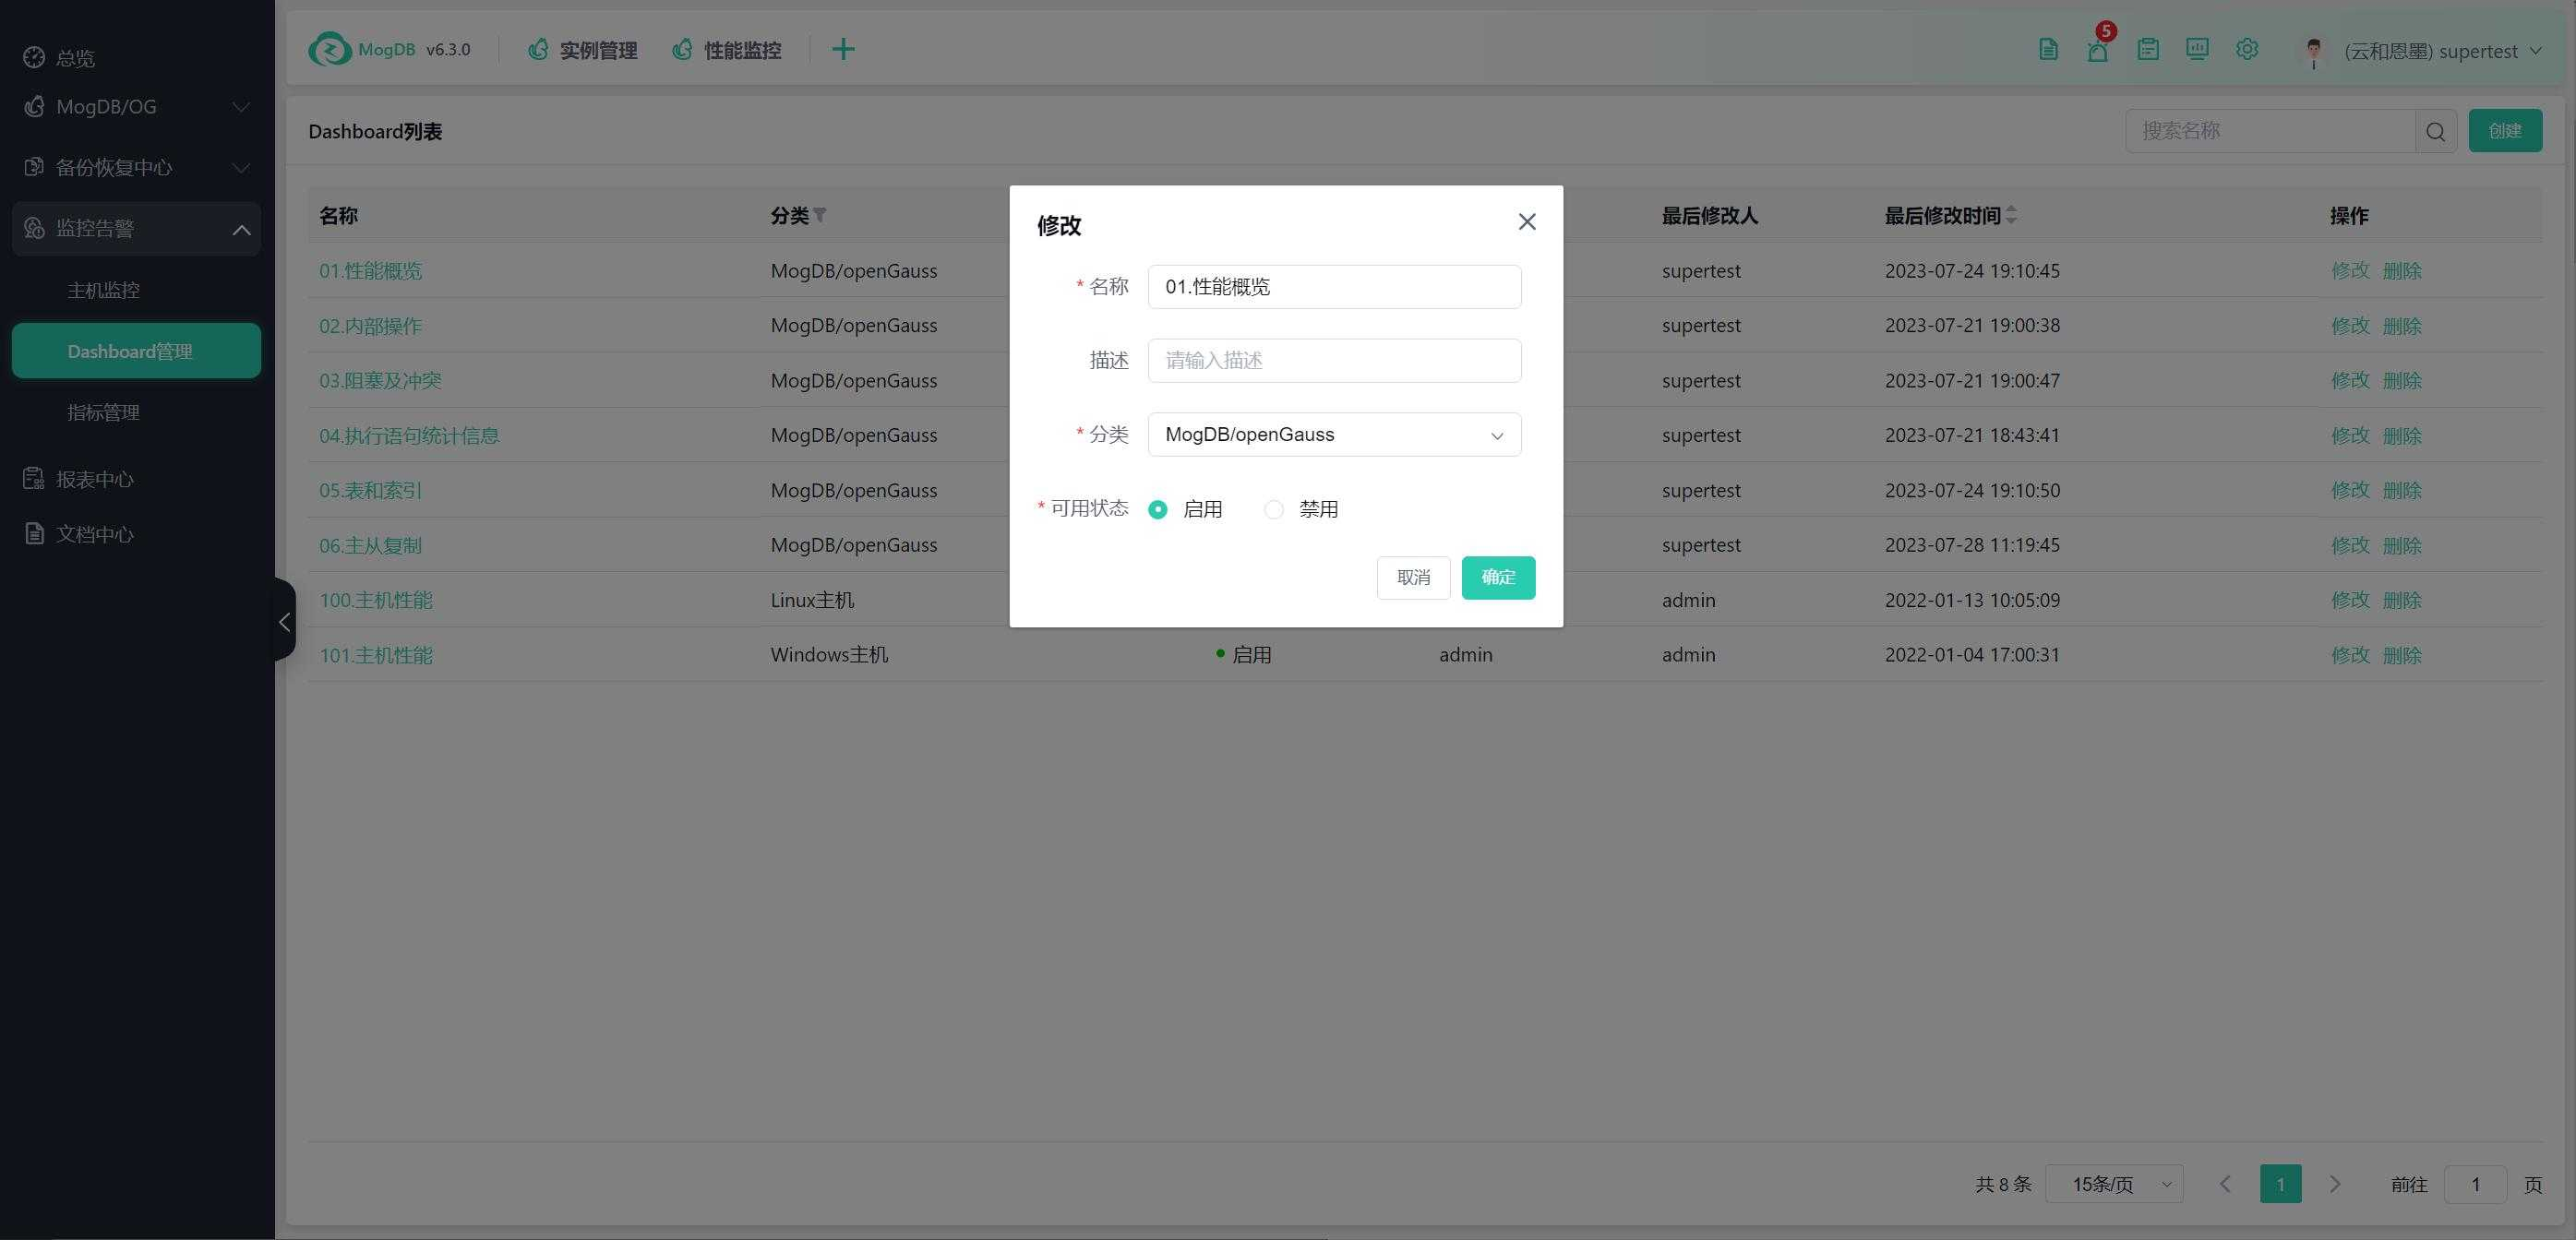
Modify the dashboard name, category, and activation status.
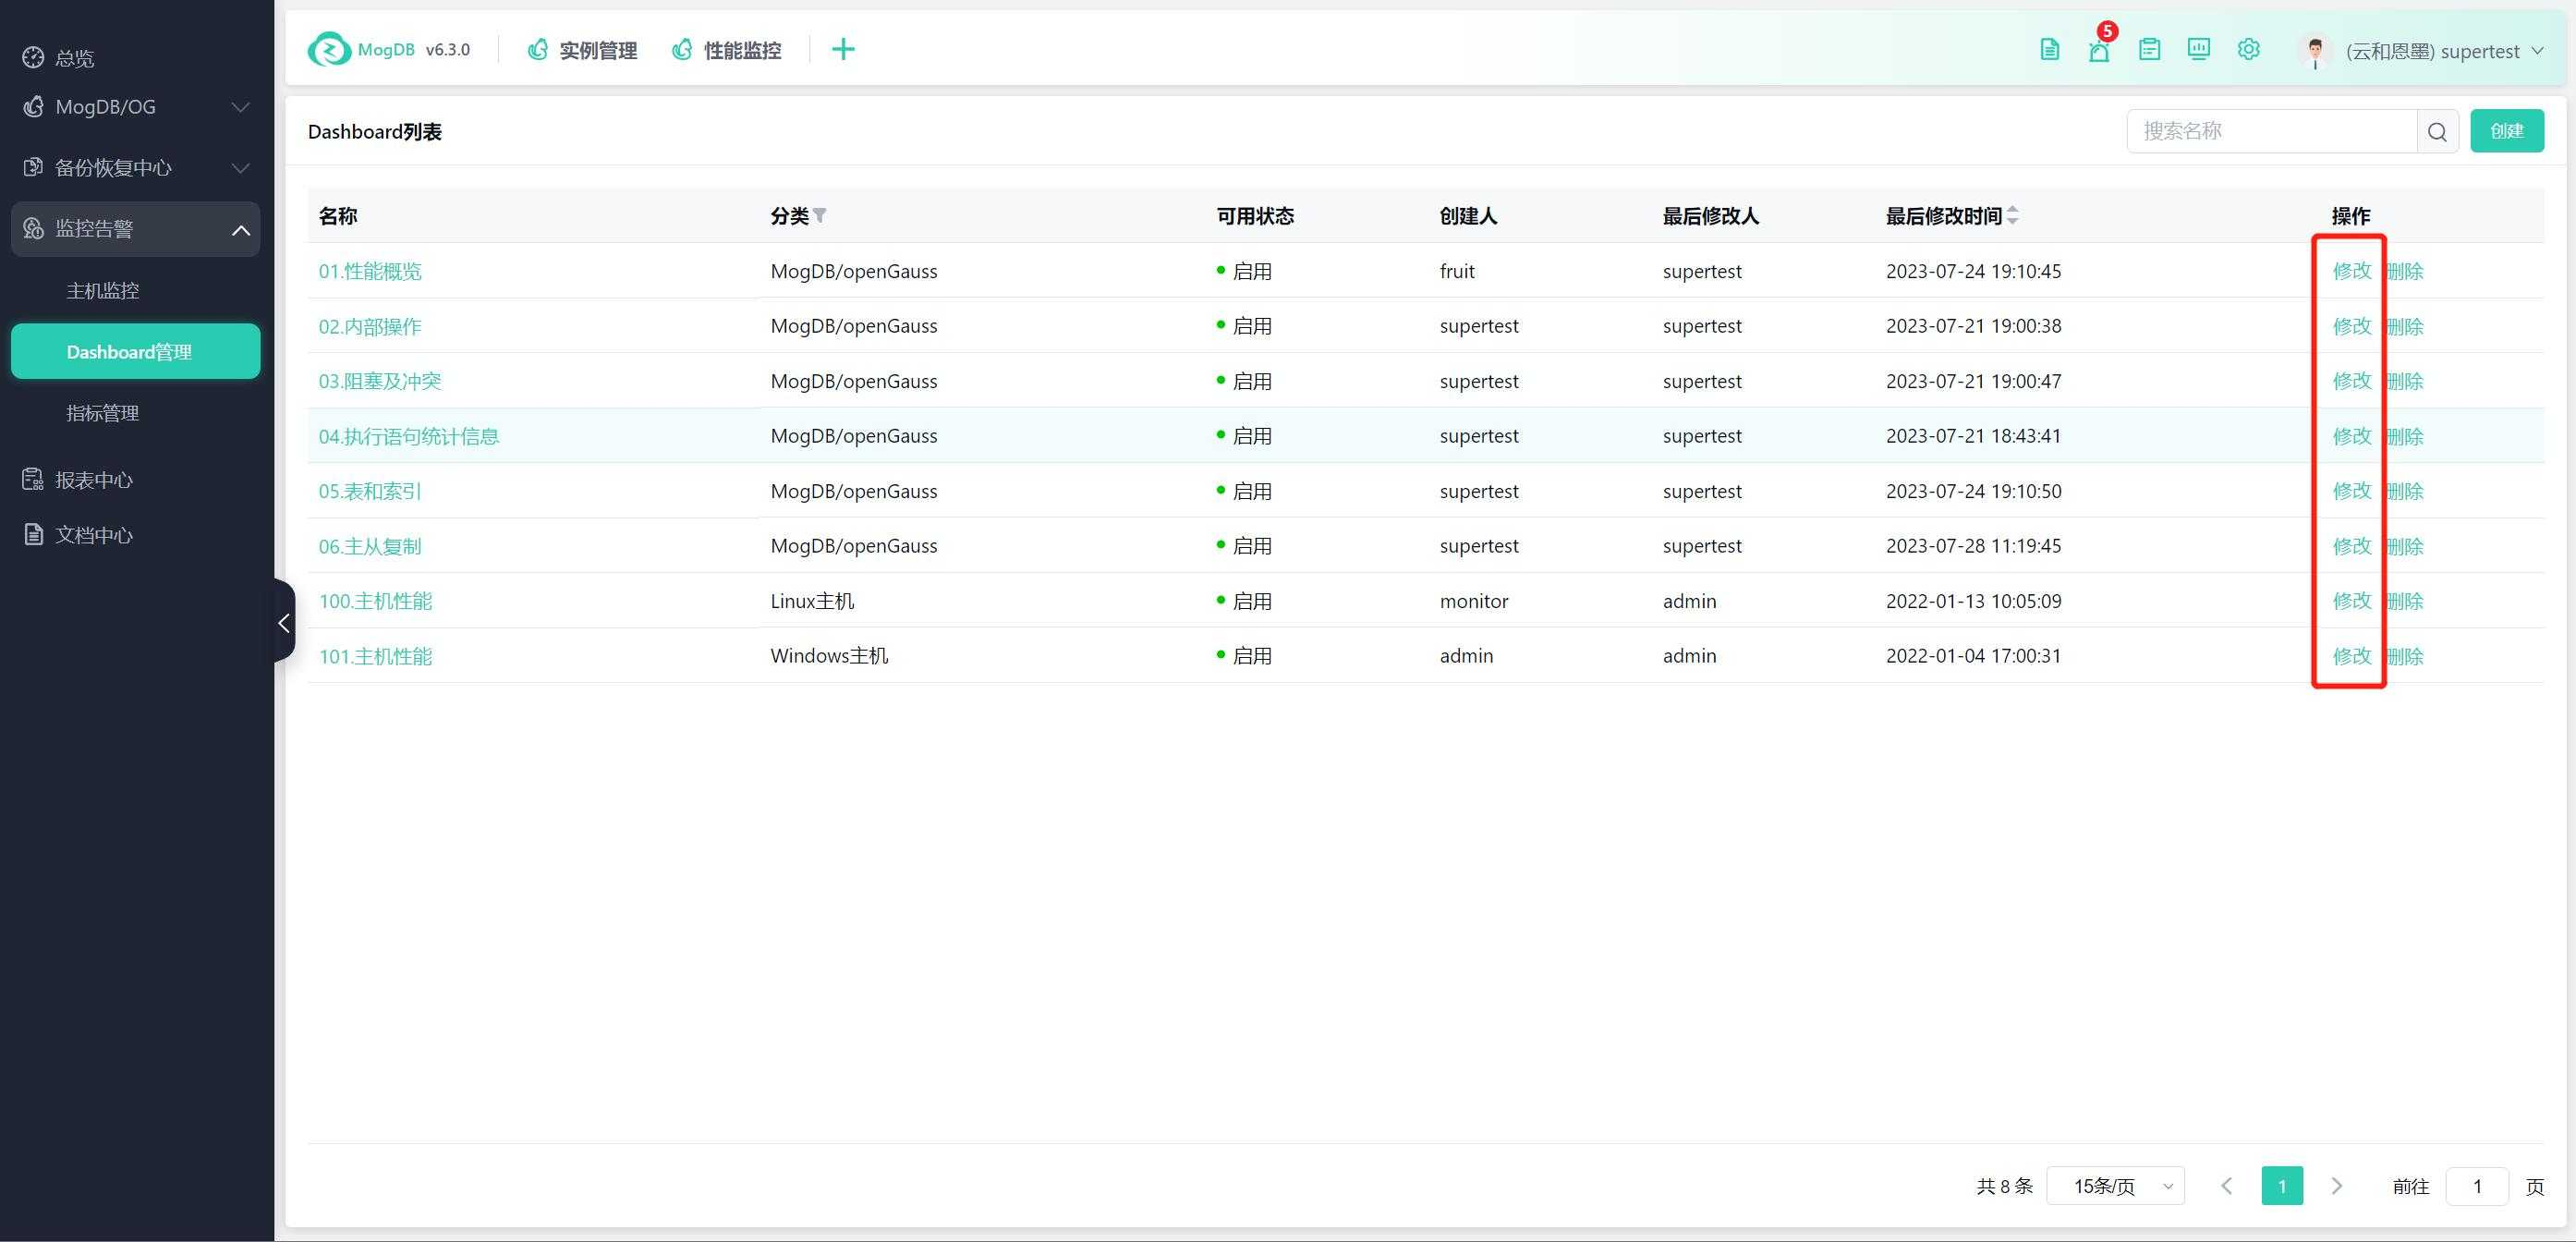
Click on the dashboard name to enter the dashboard editing page.
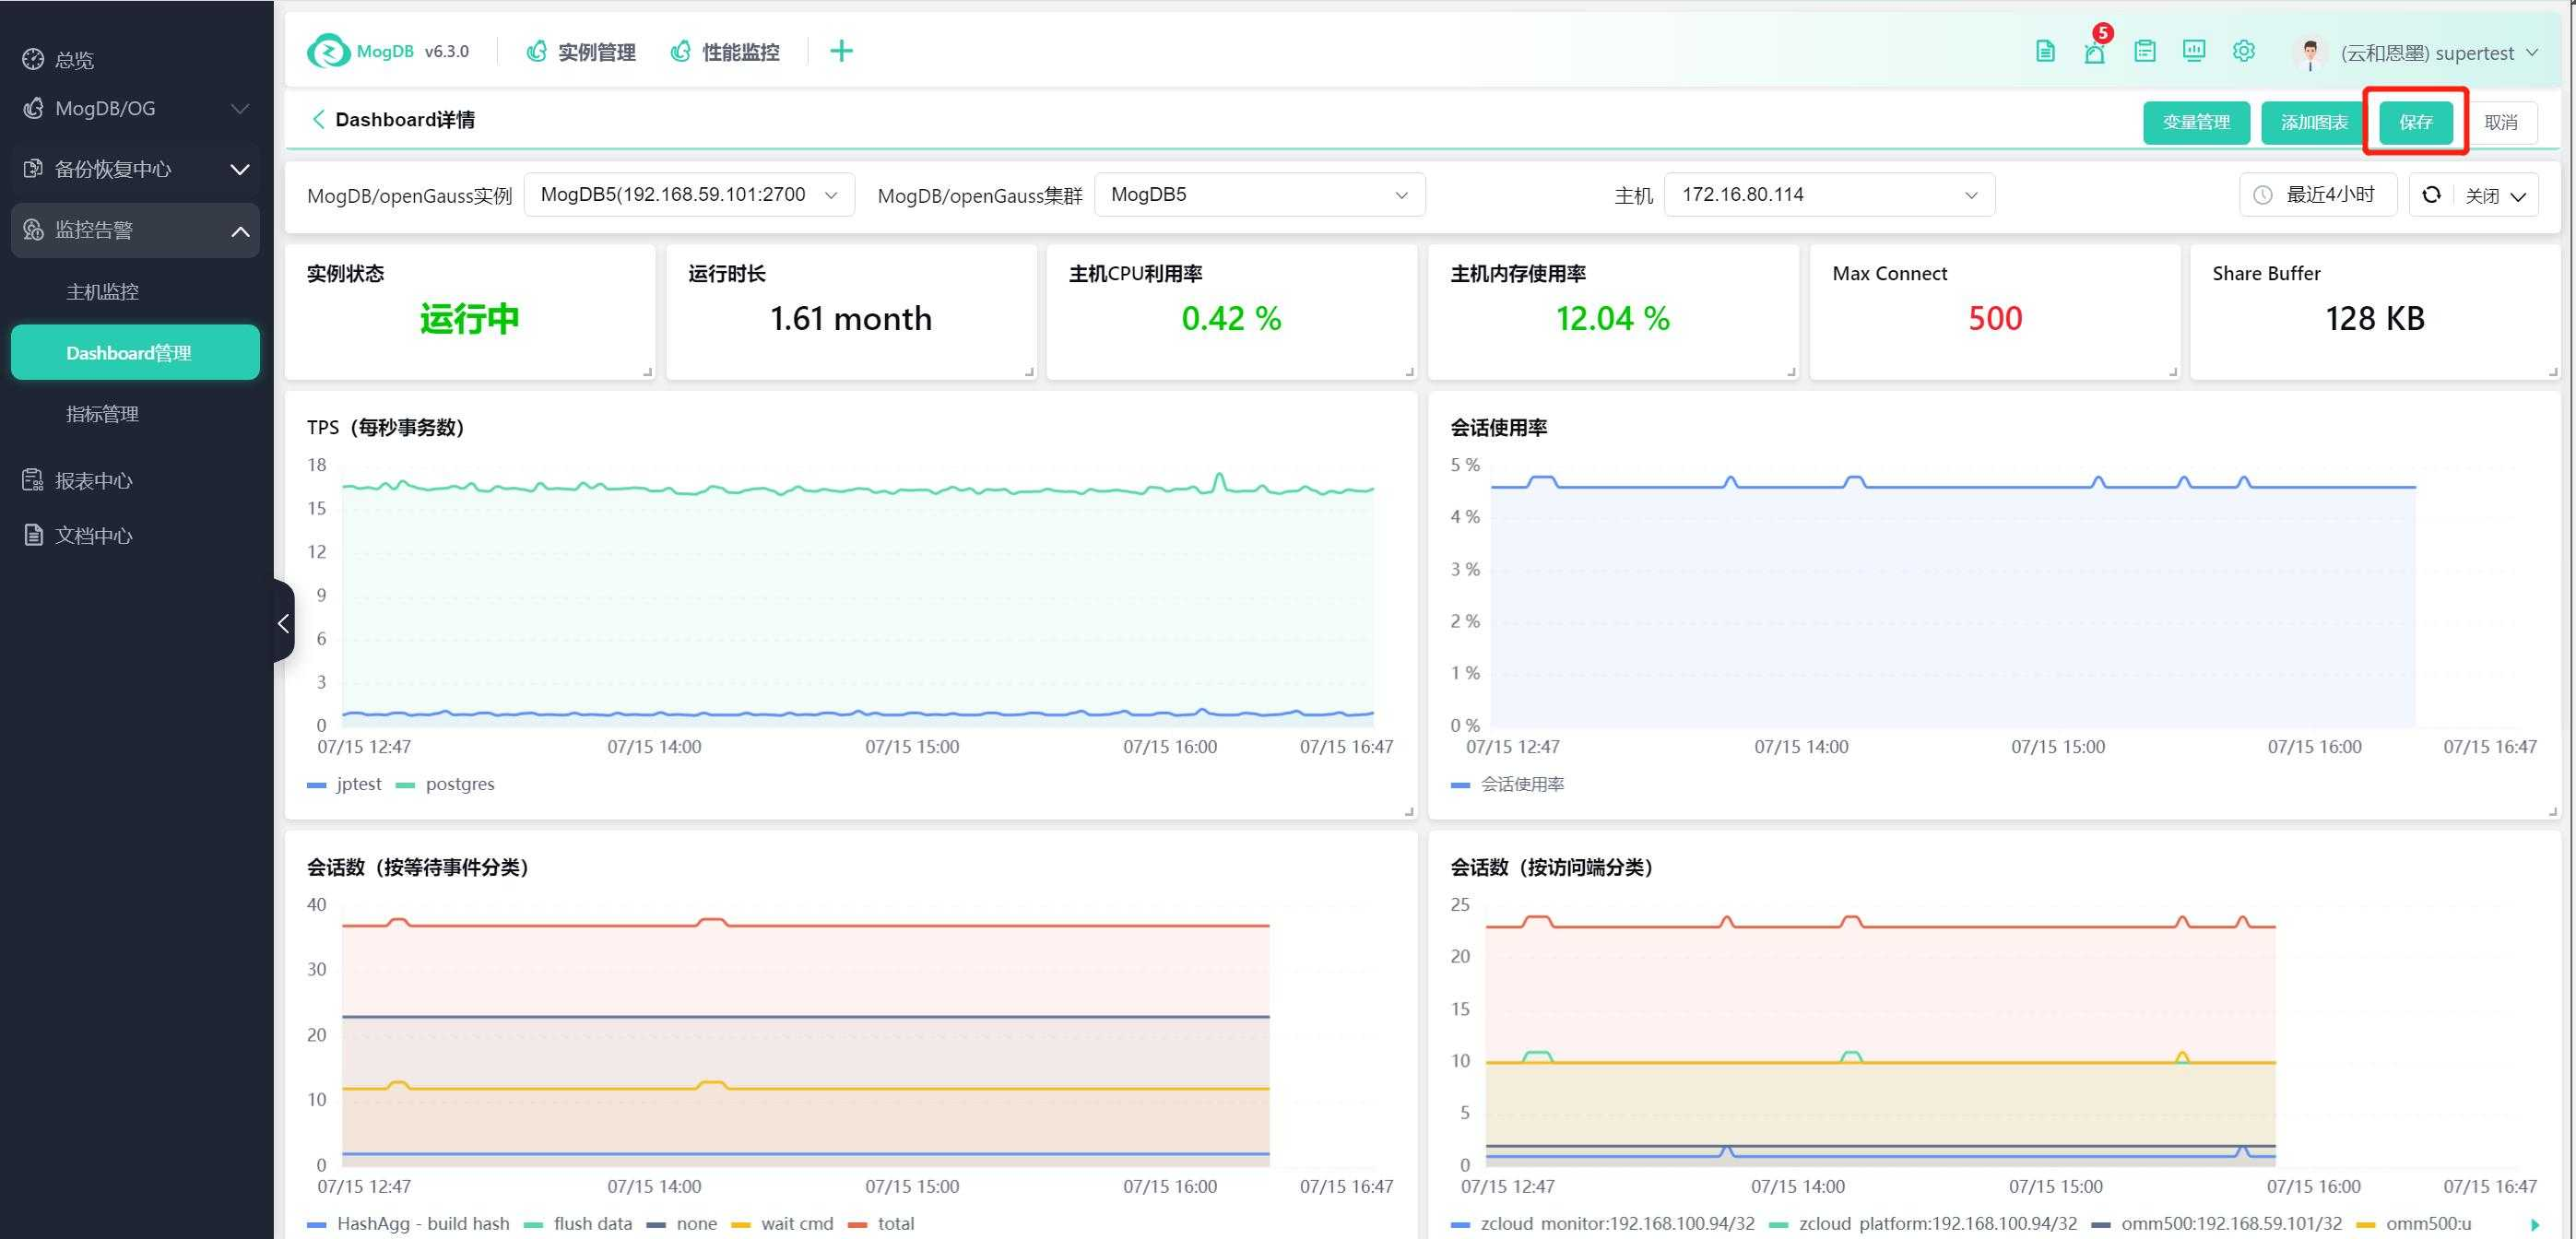
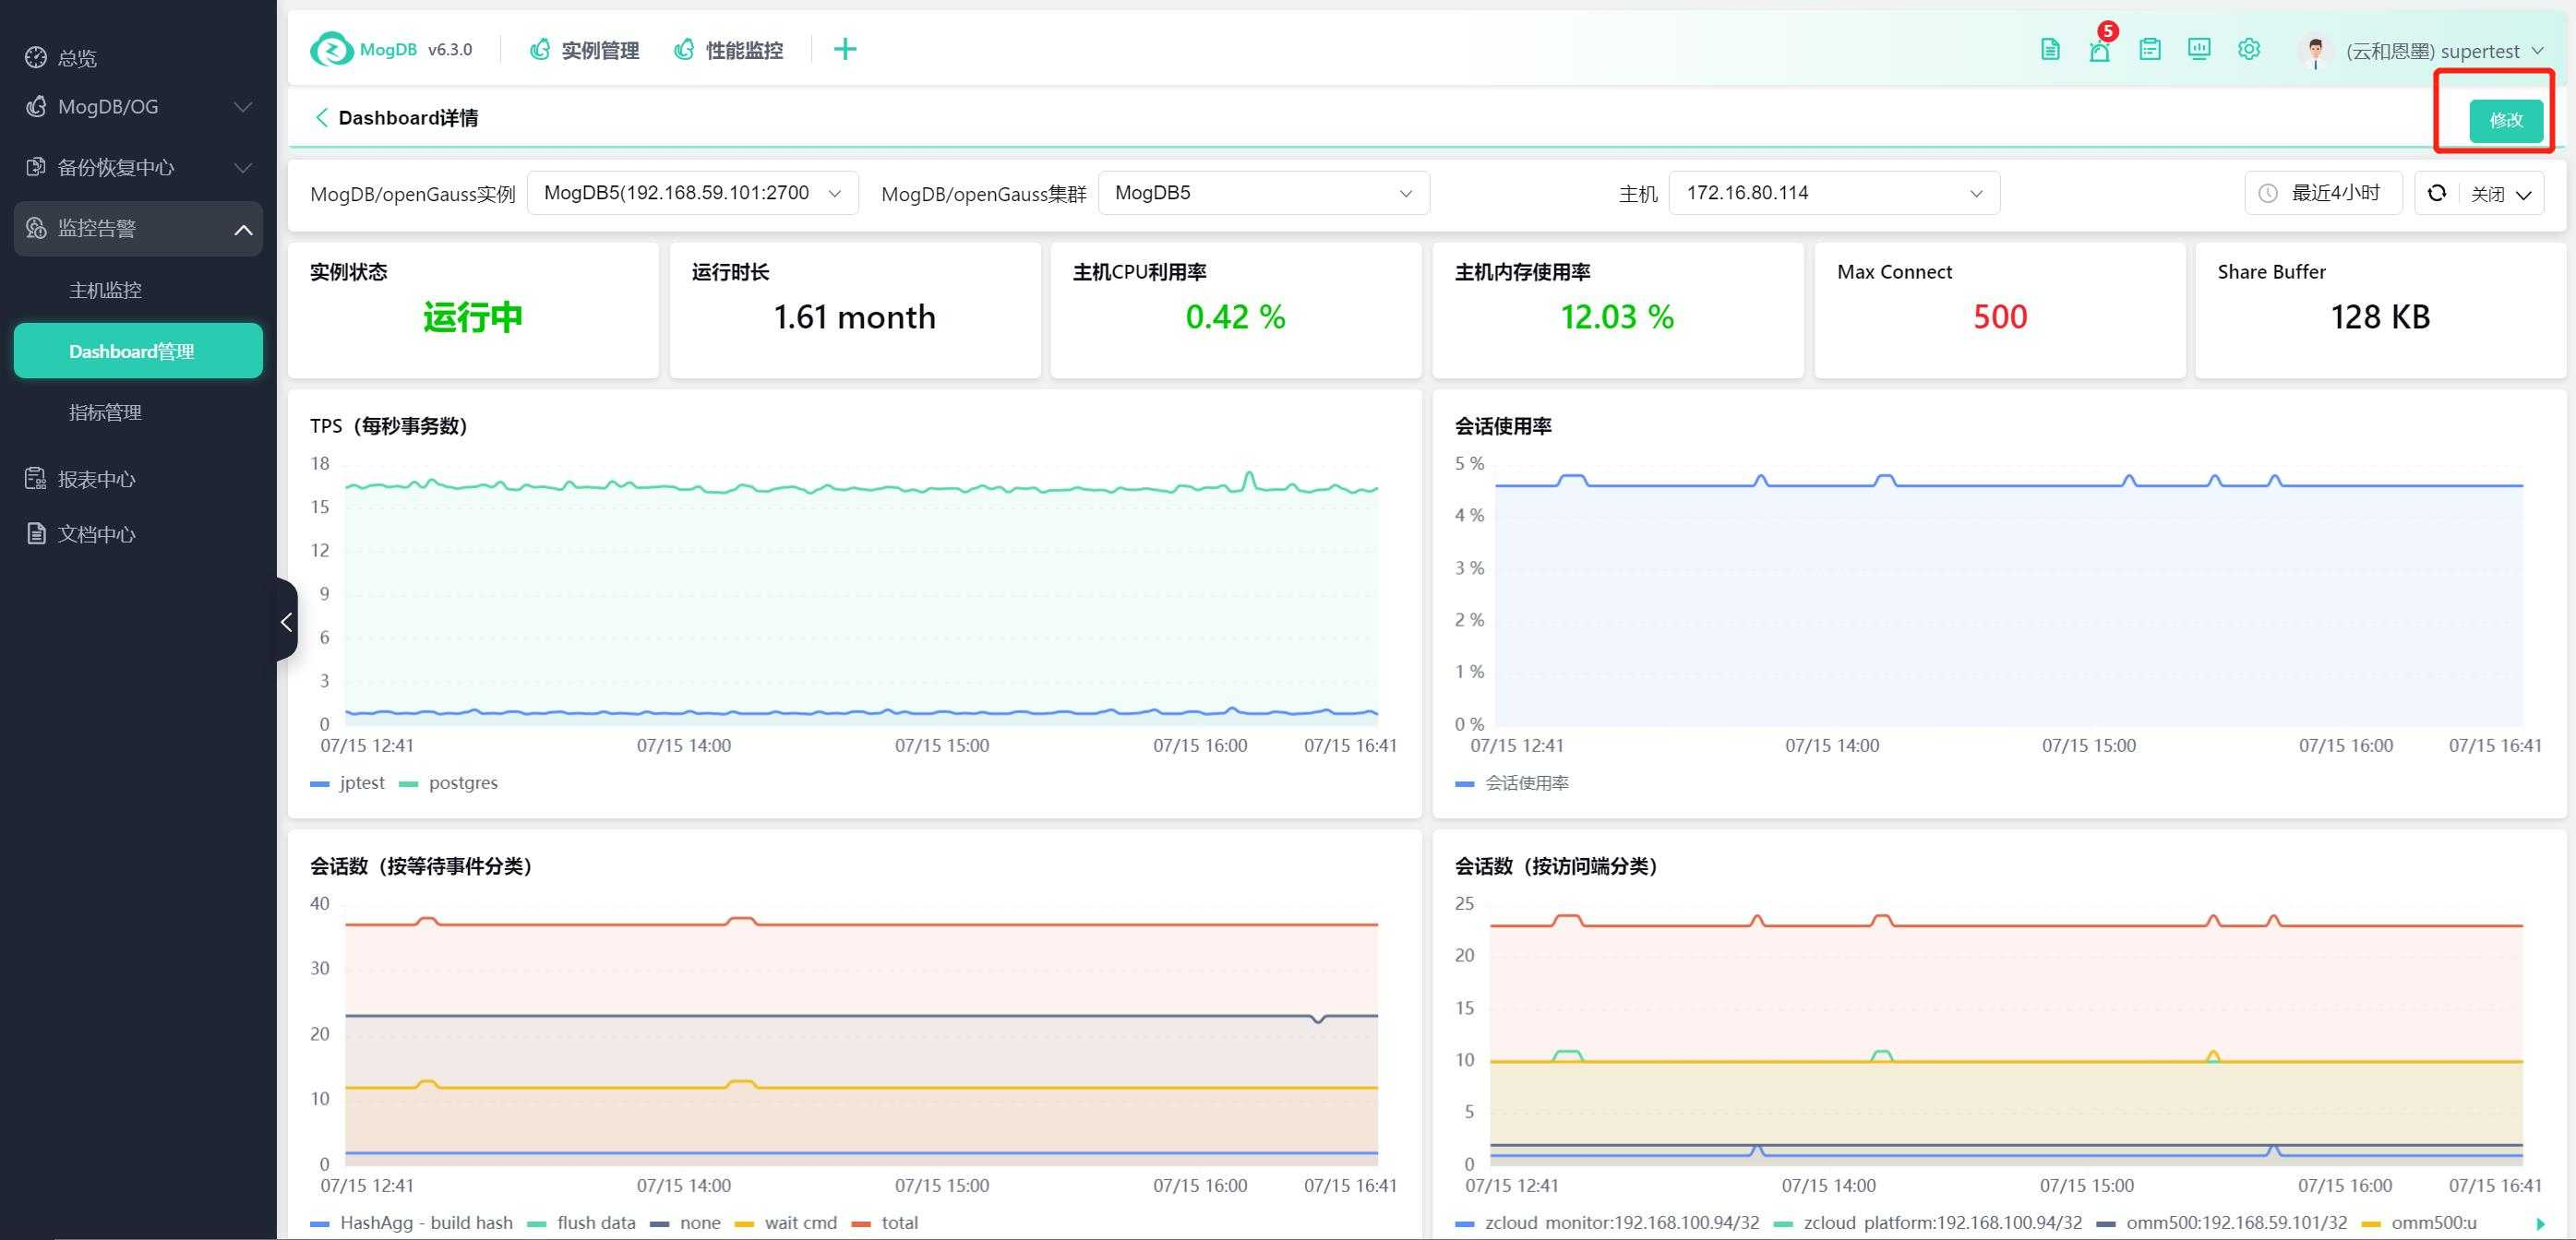
Customize Dashboard
Create a custom dashboard by modifying an existing dashboard or creating a new one, which can include custom charts.
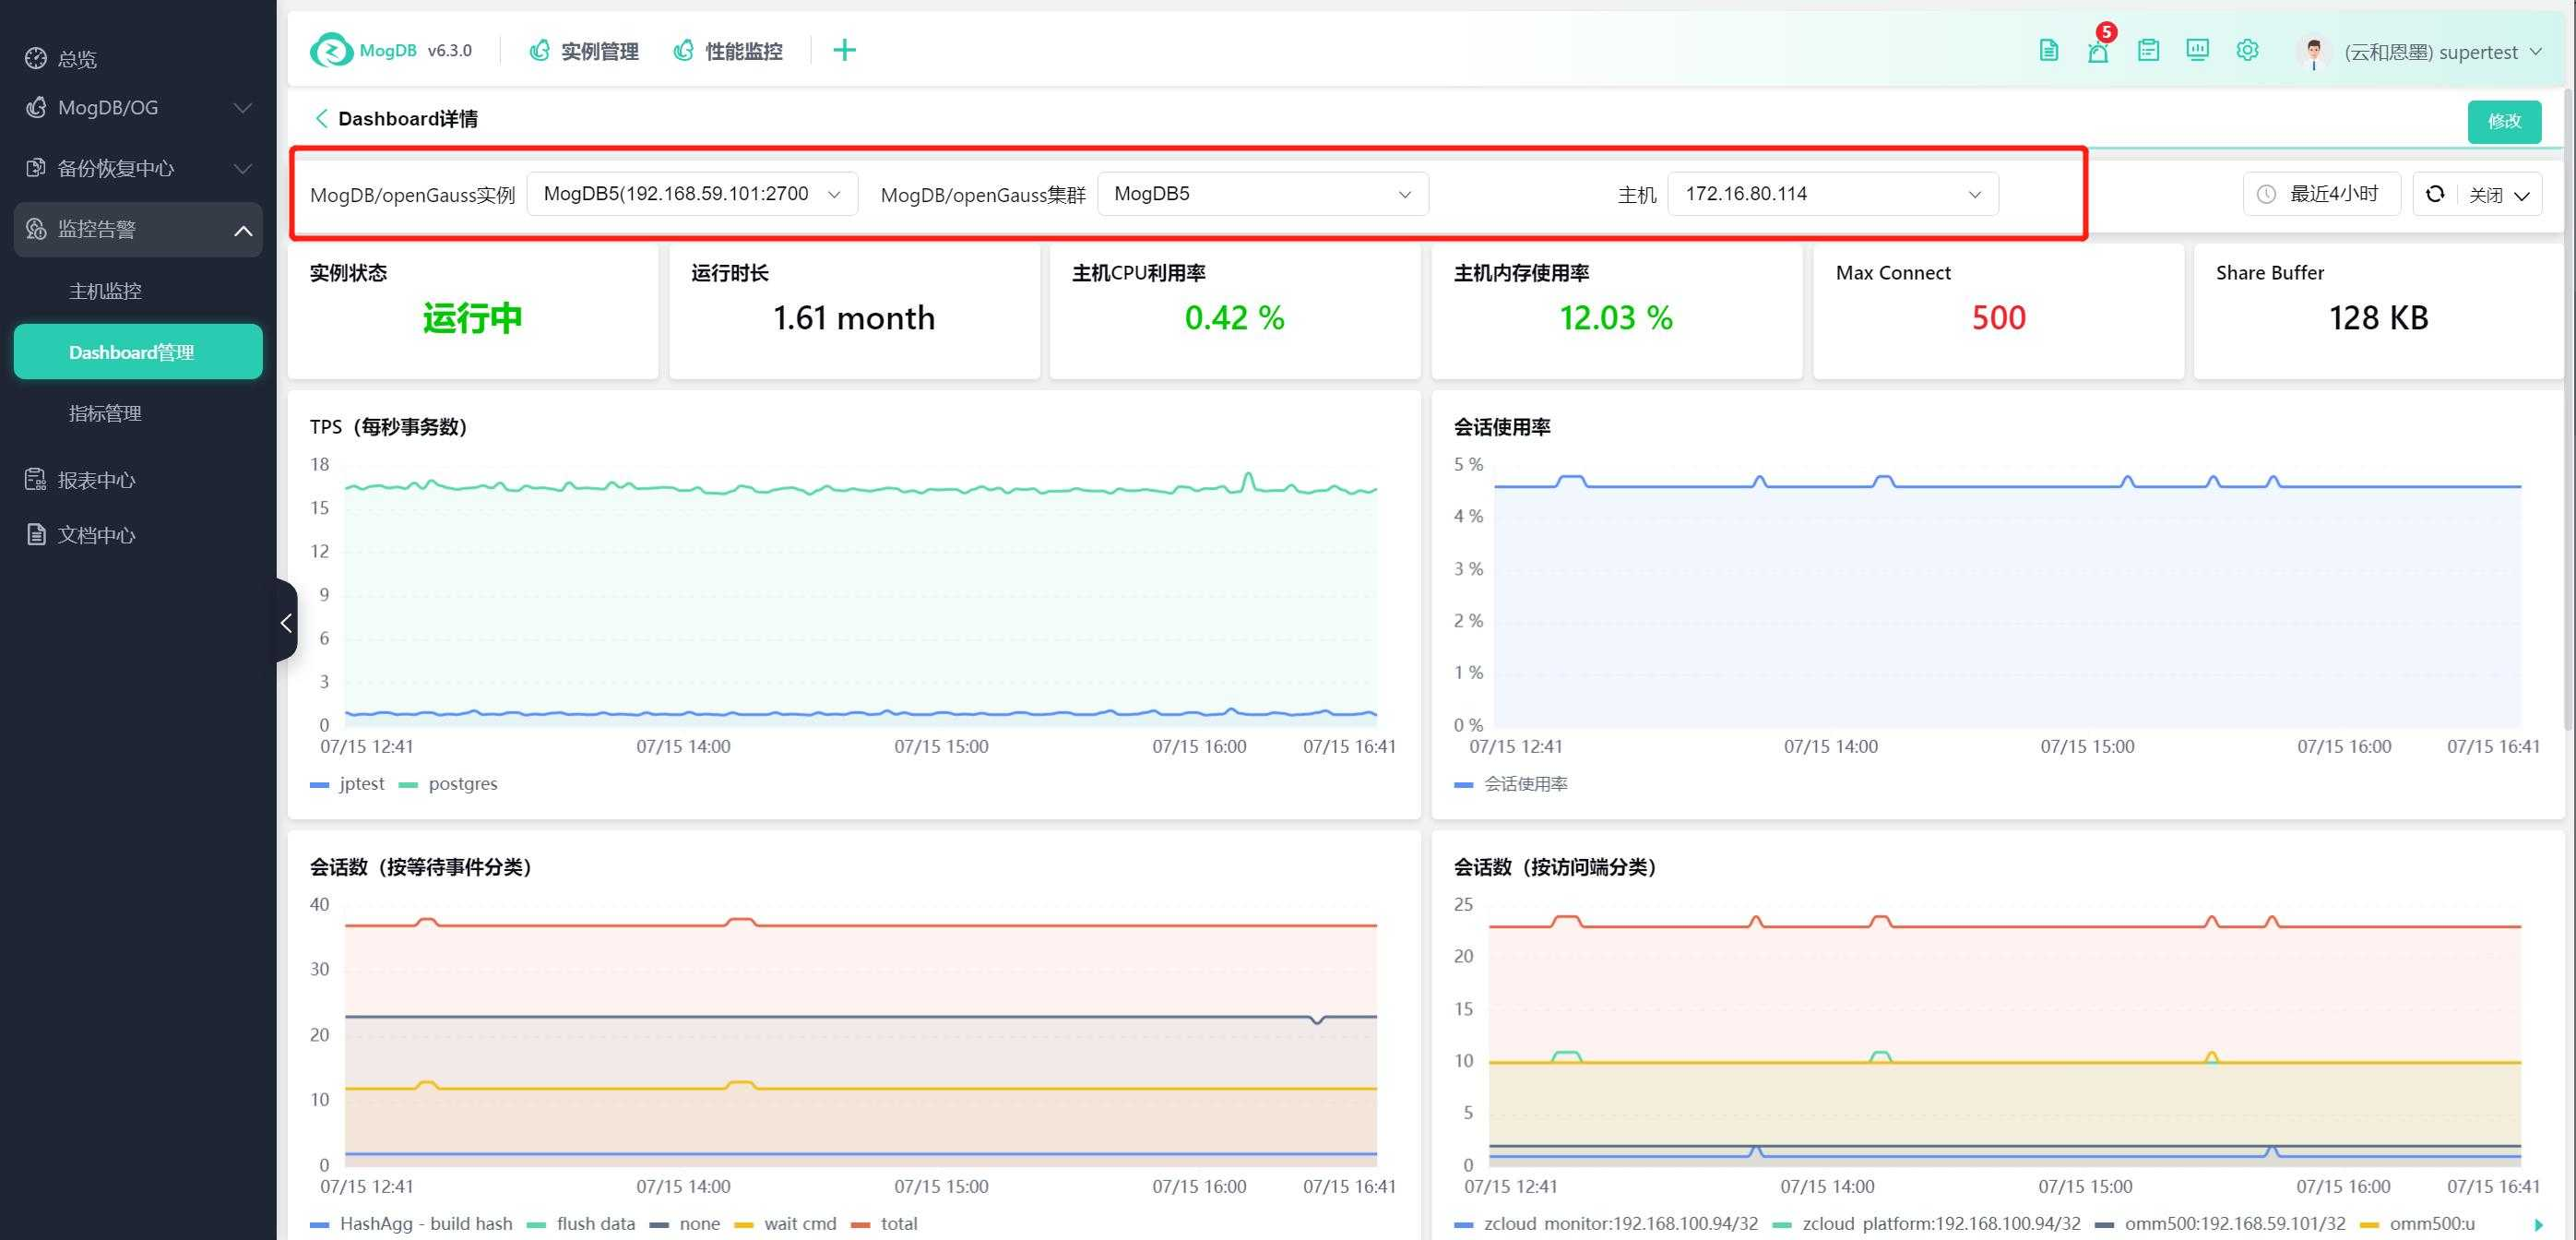
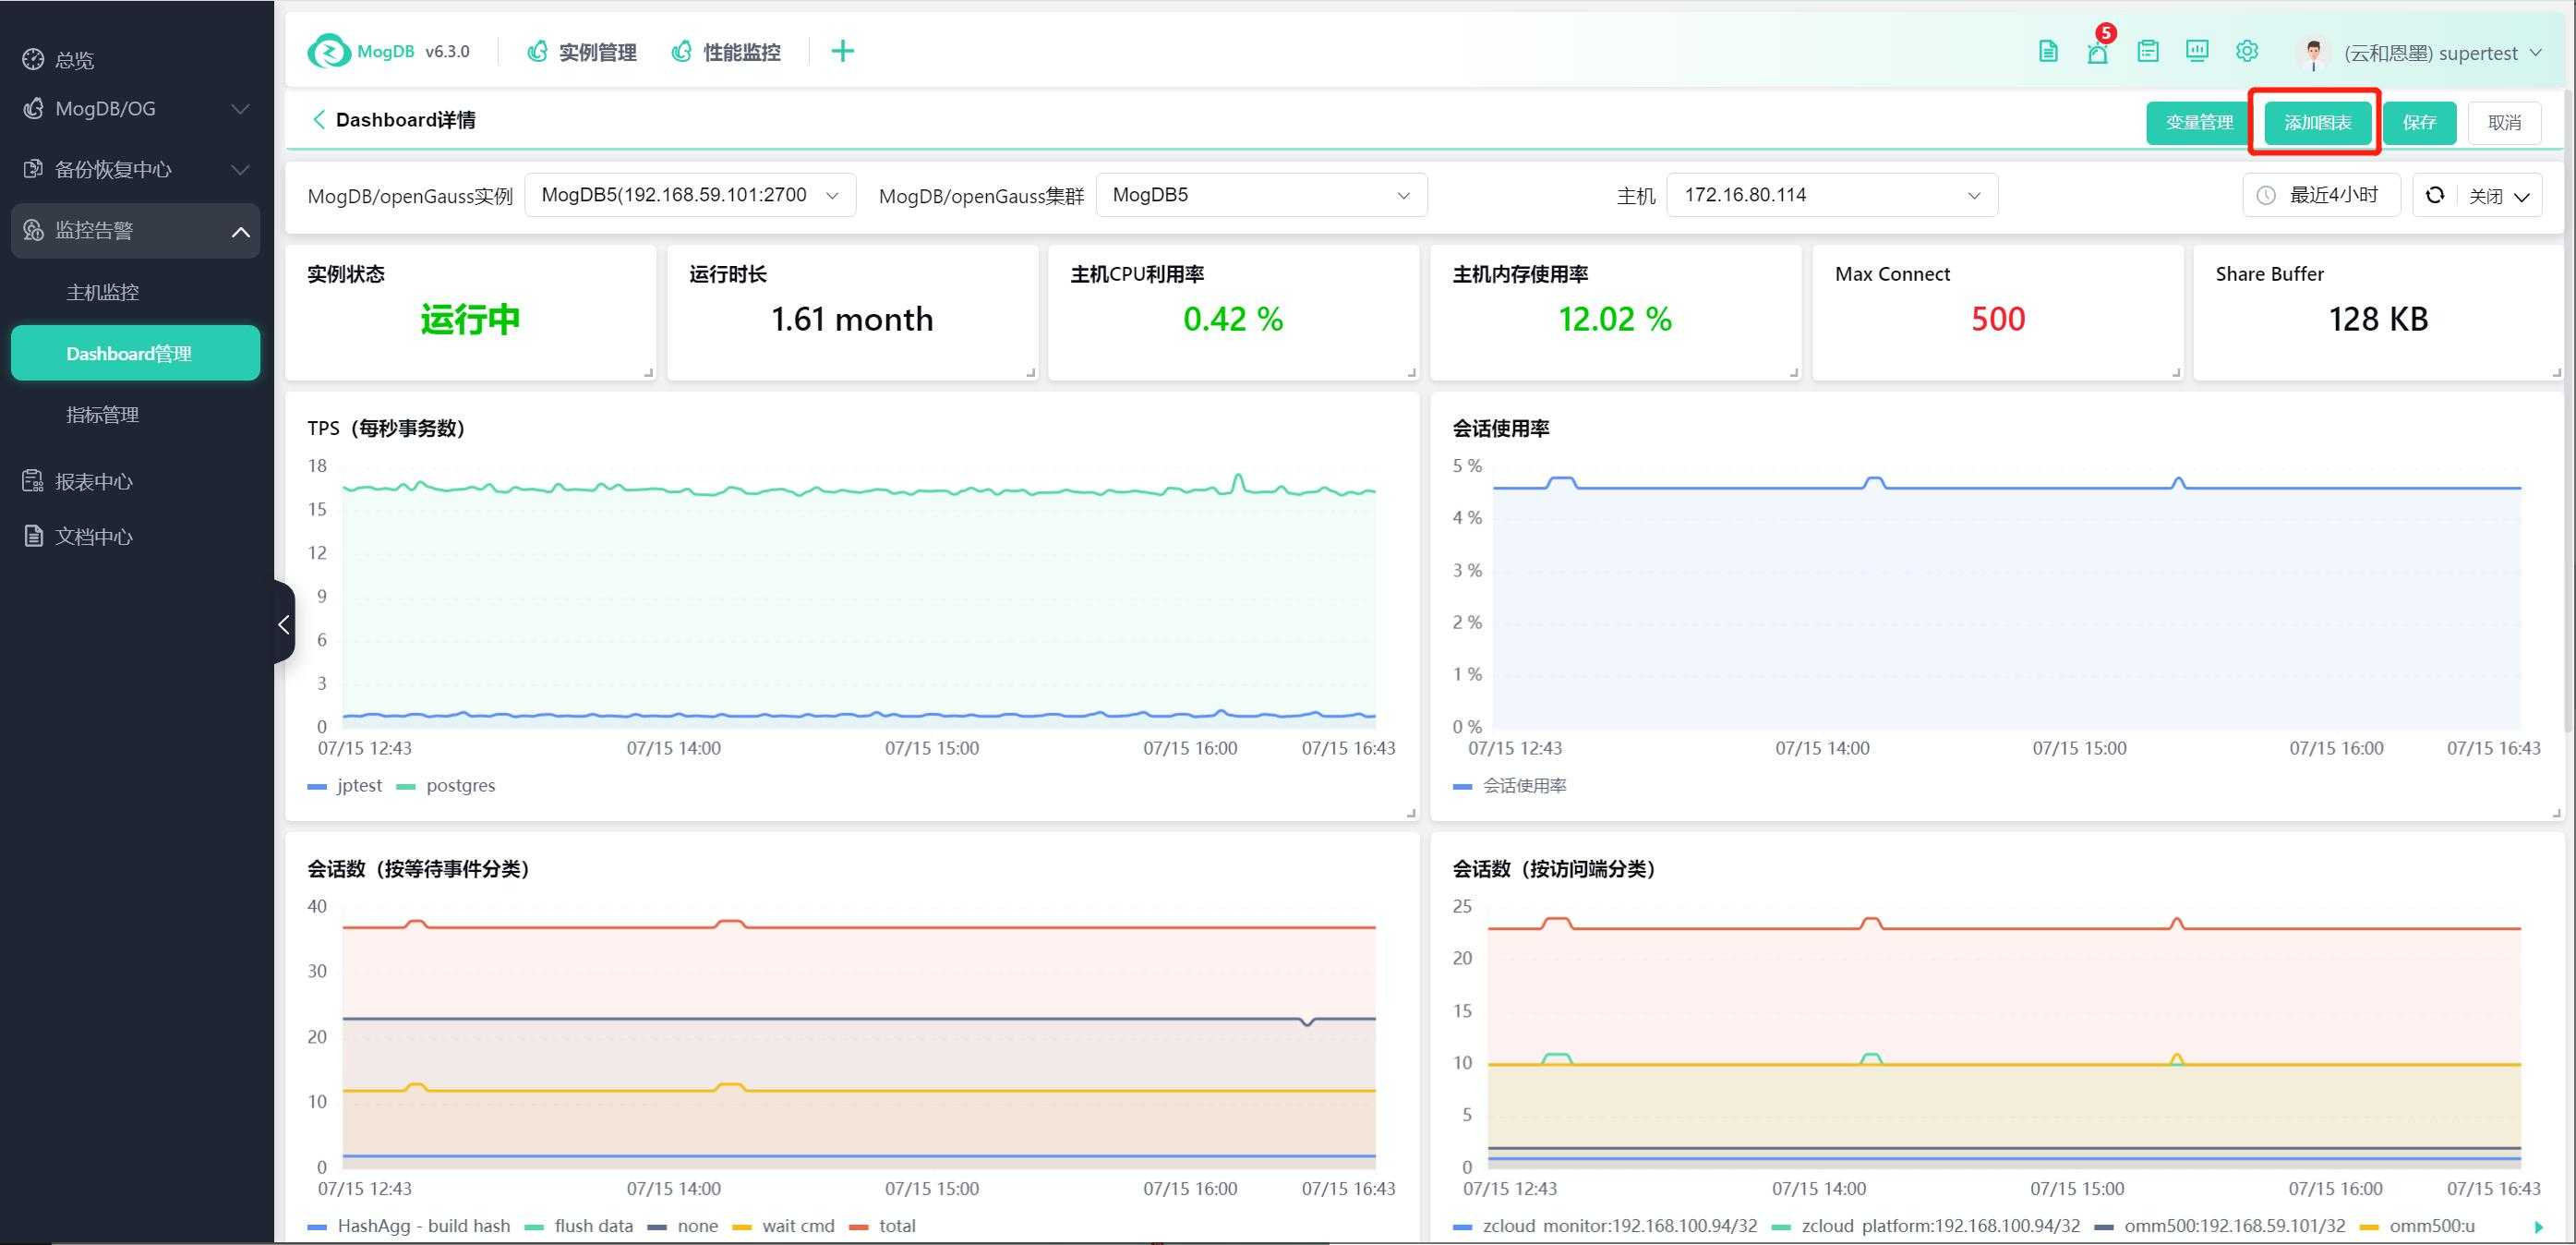
In the dashboard editing page, there is no data displayed initially. You can specify MogDB instances, MogDB clusters, and hosts as monitoring data sources to display on the template for configuration and debugging.
Click the "Edit" button to modify individual charts.
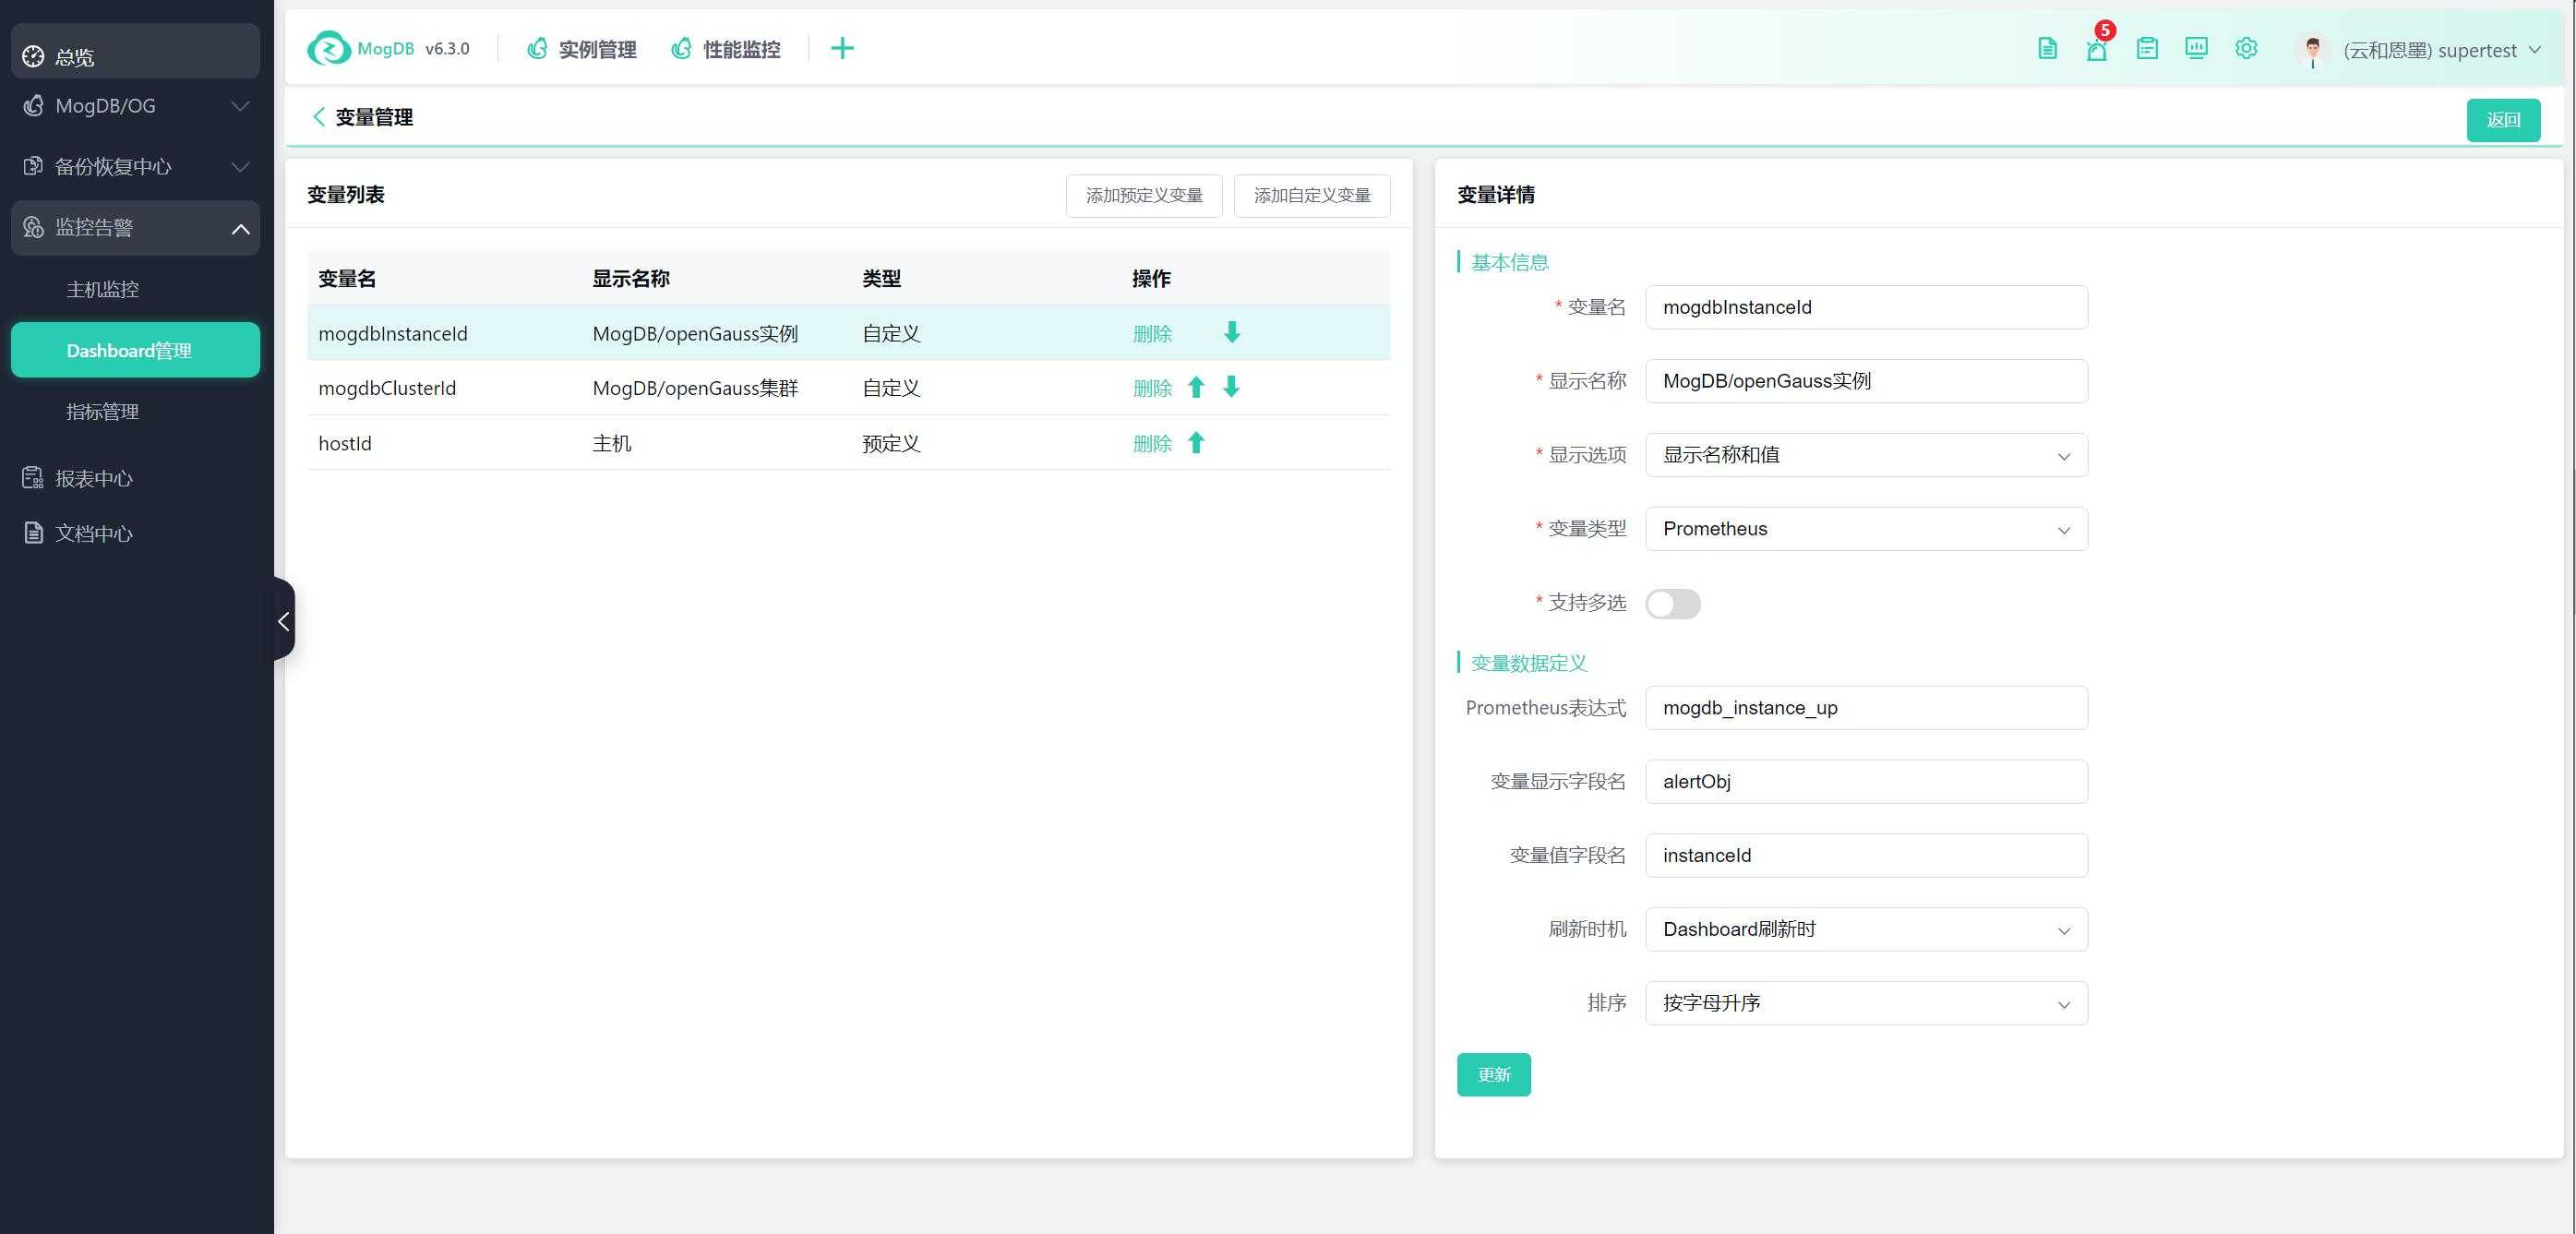
Click "Variable Management" to set predefined and custom variables for use when collecting custom charts.
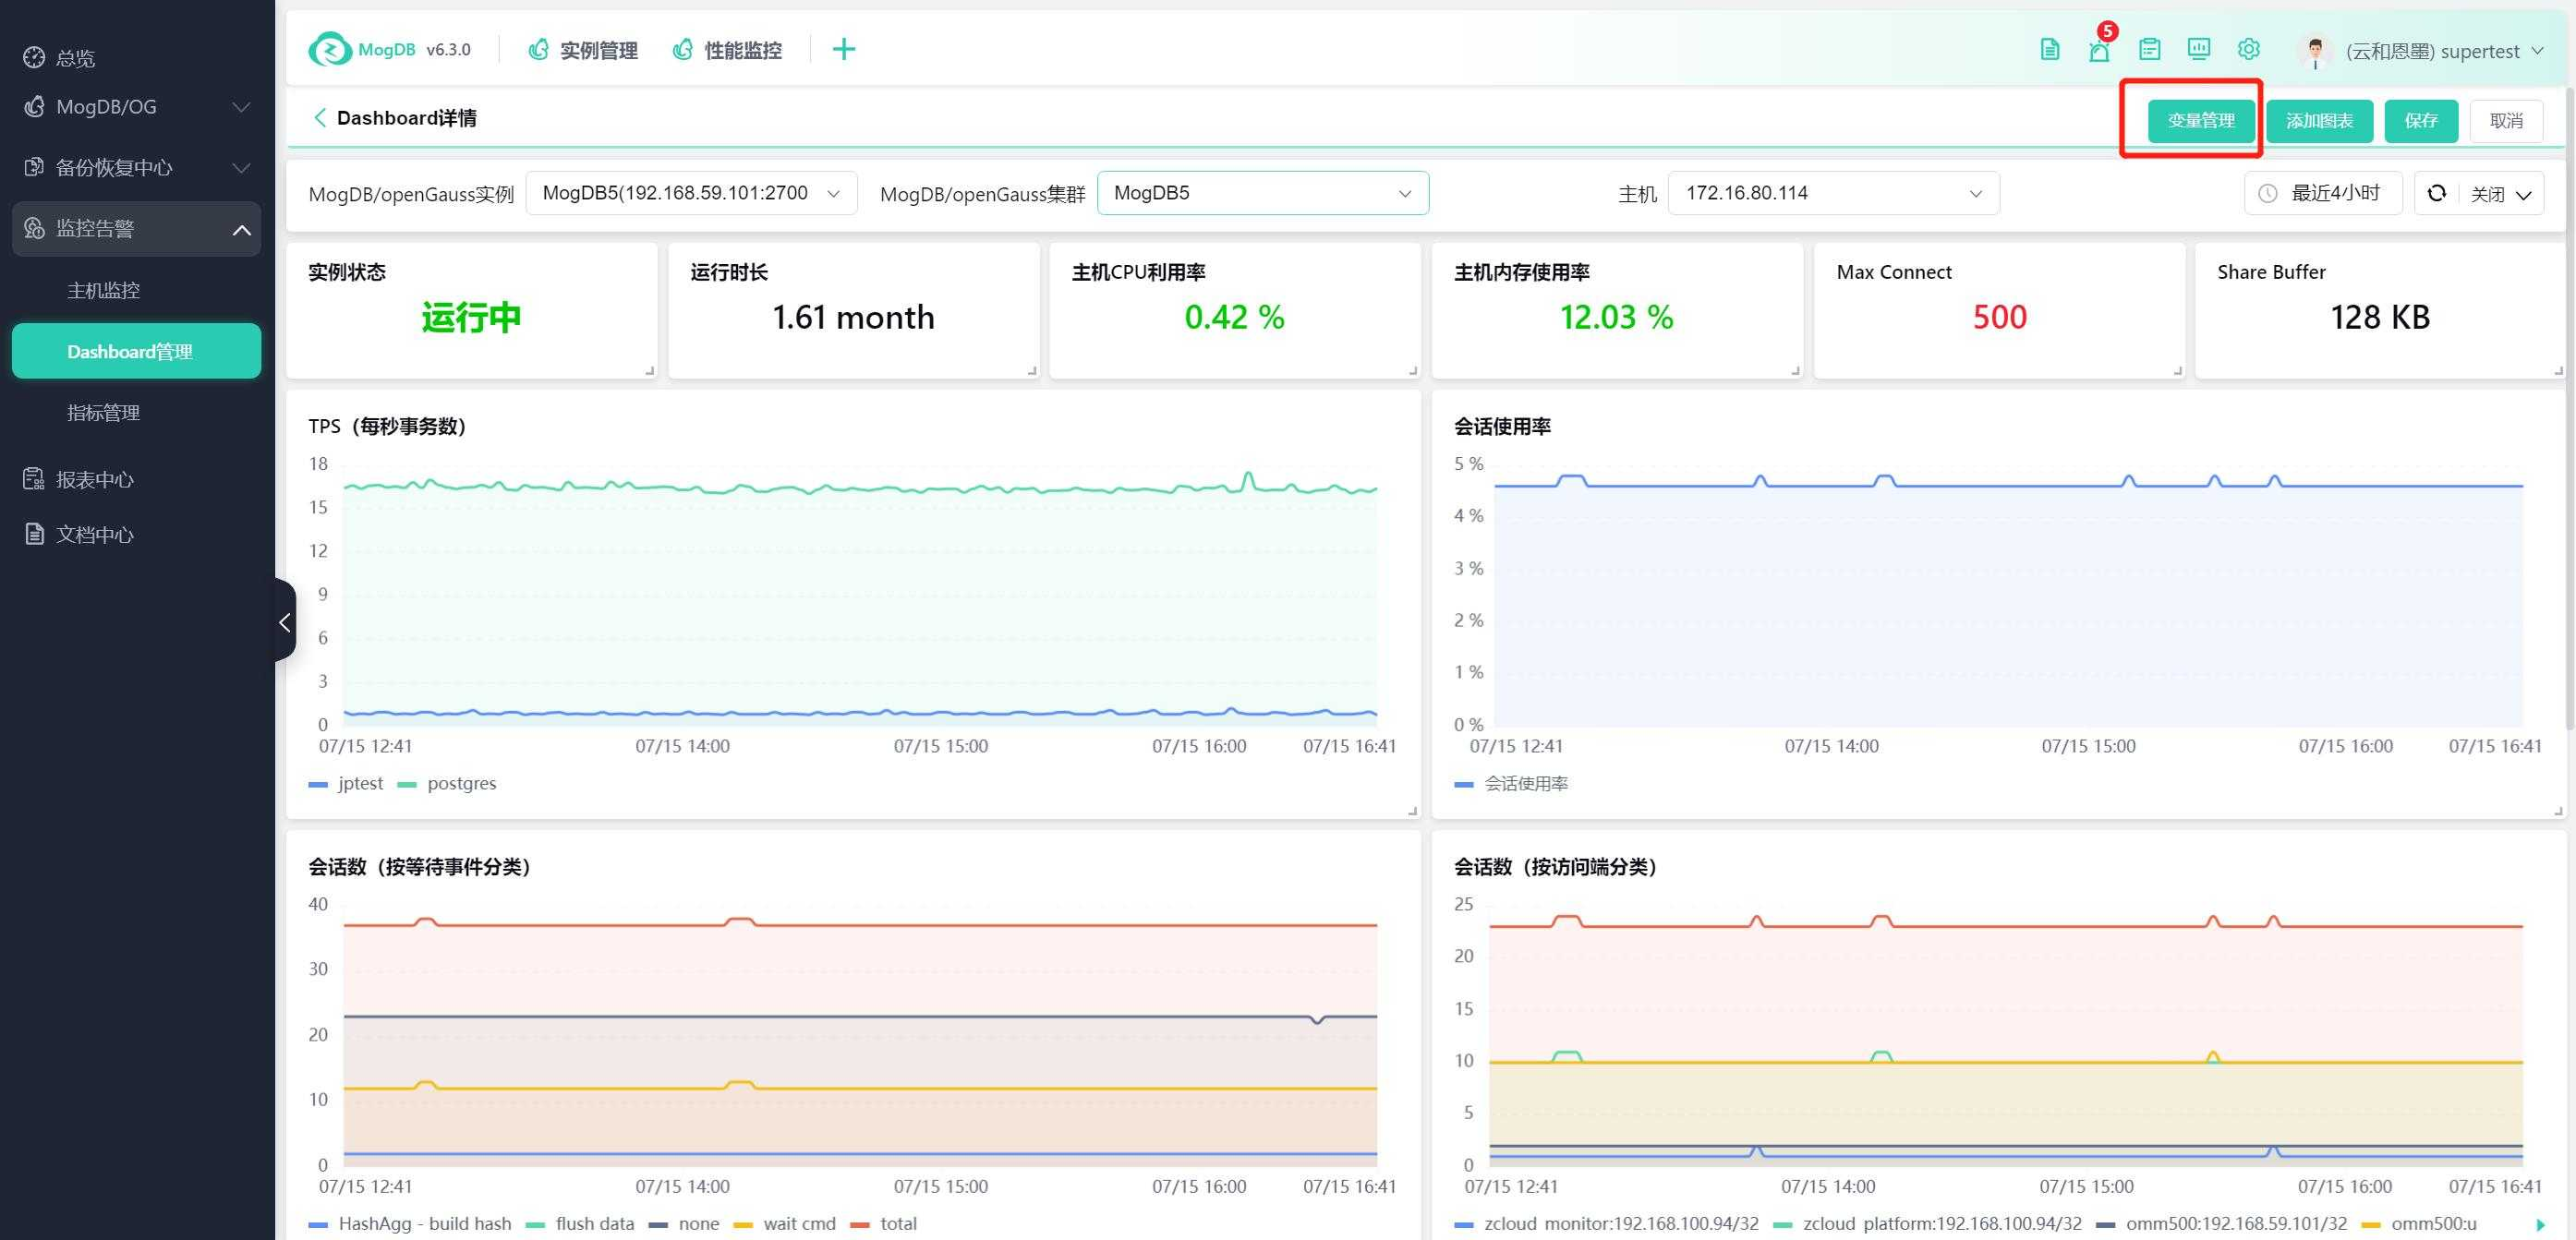
Click the "Add Chart" button to add custom charts.
You can choose single-value charts or graphical charts.
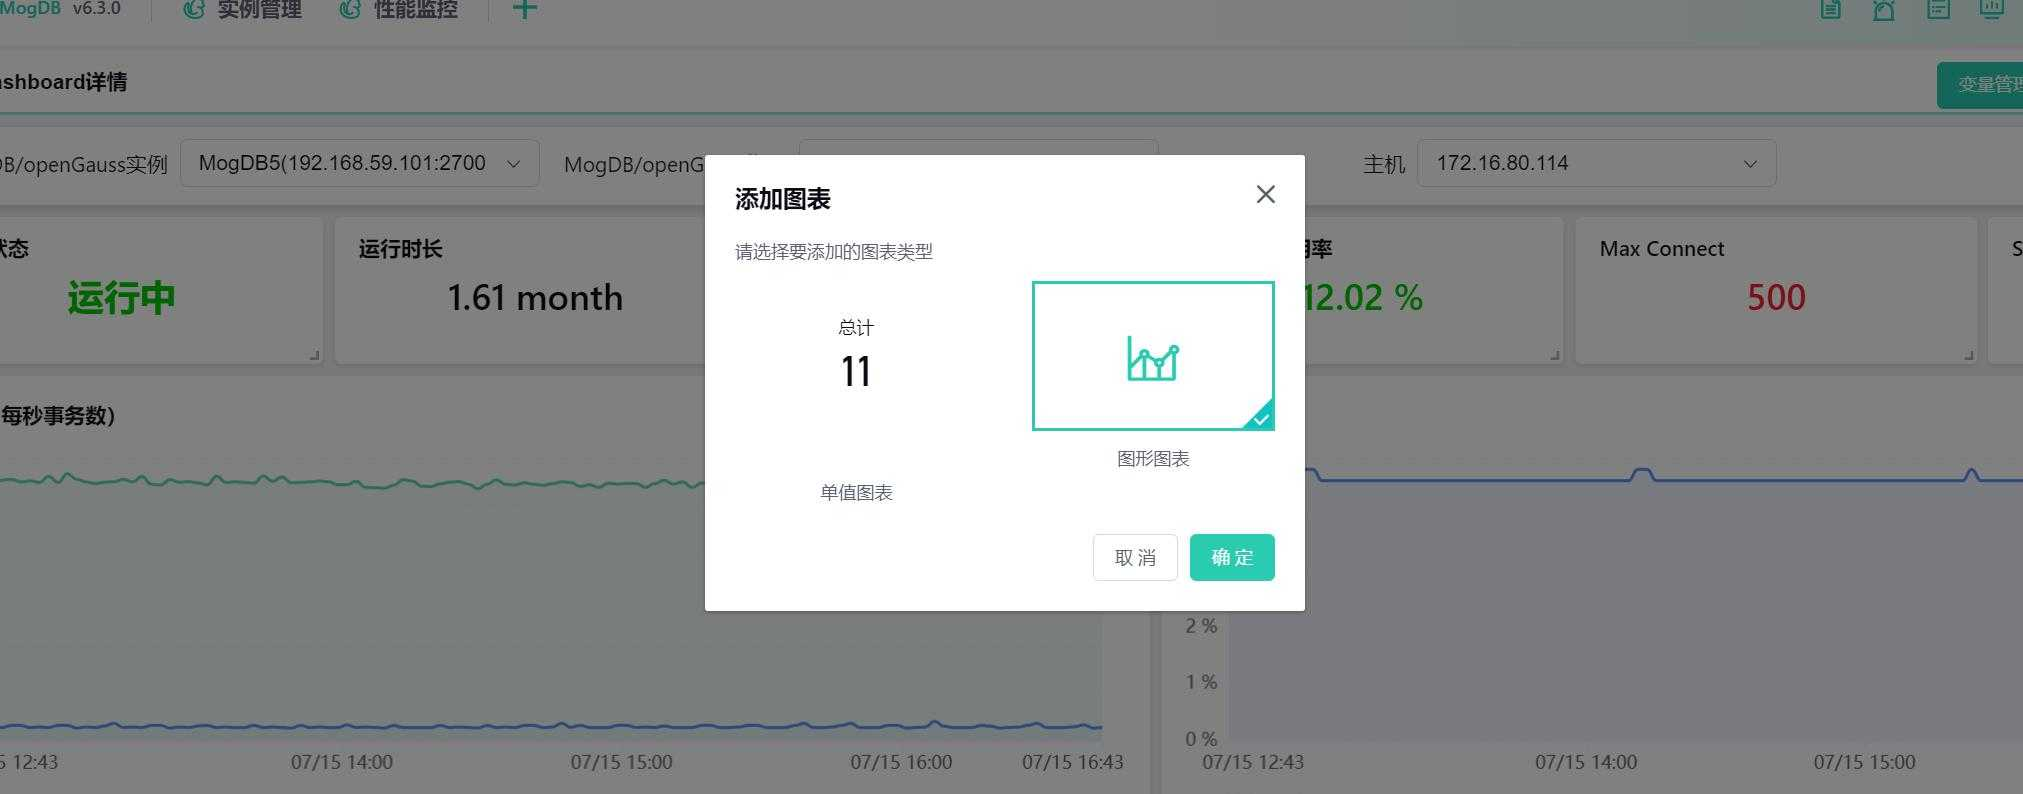
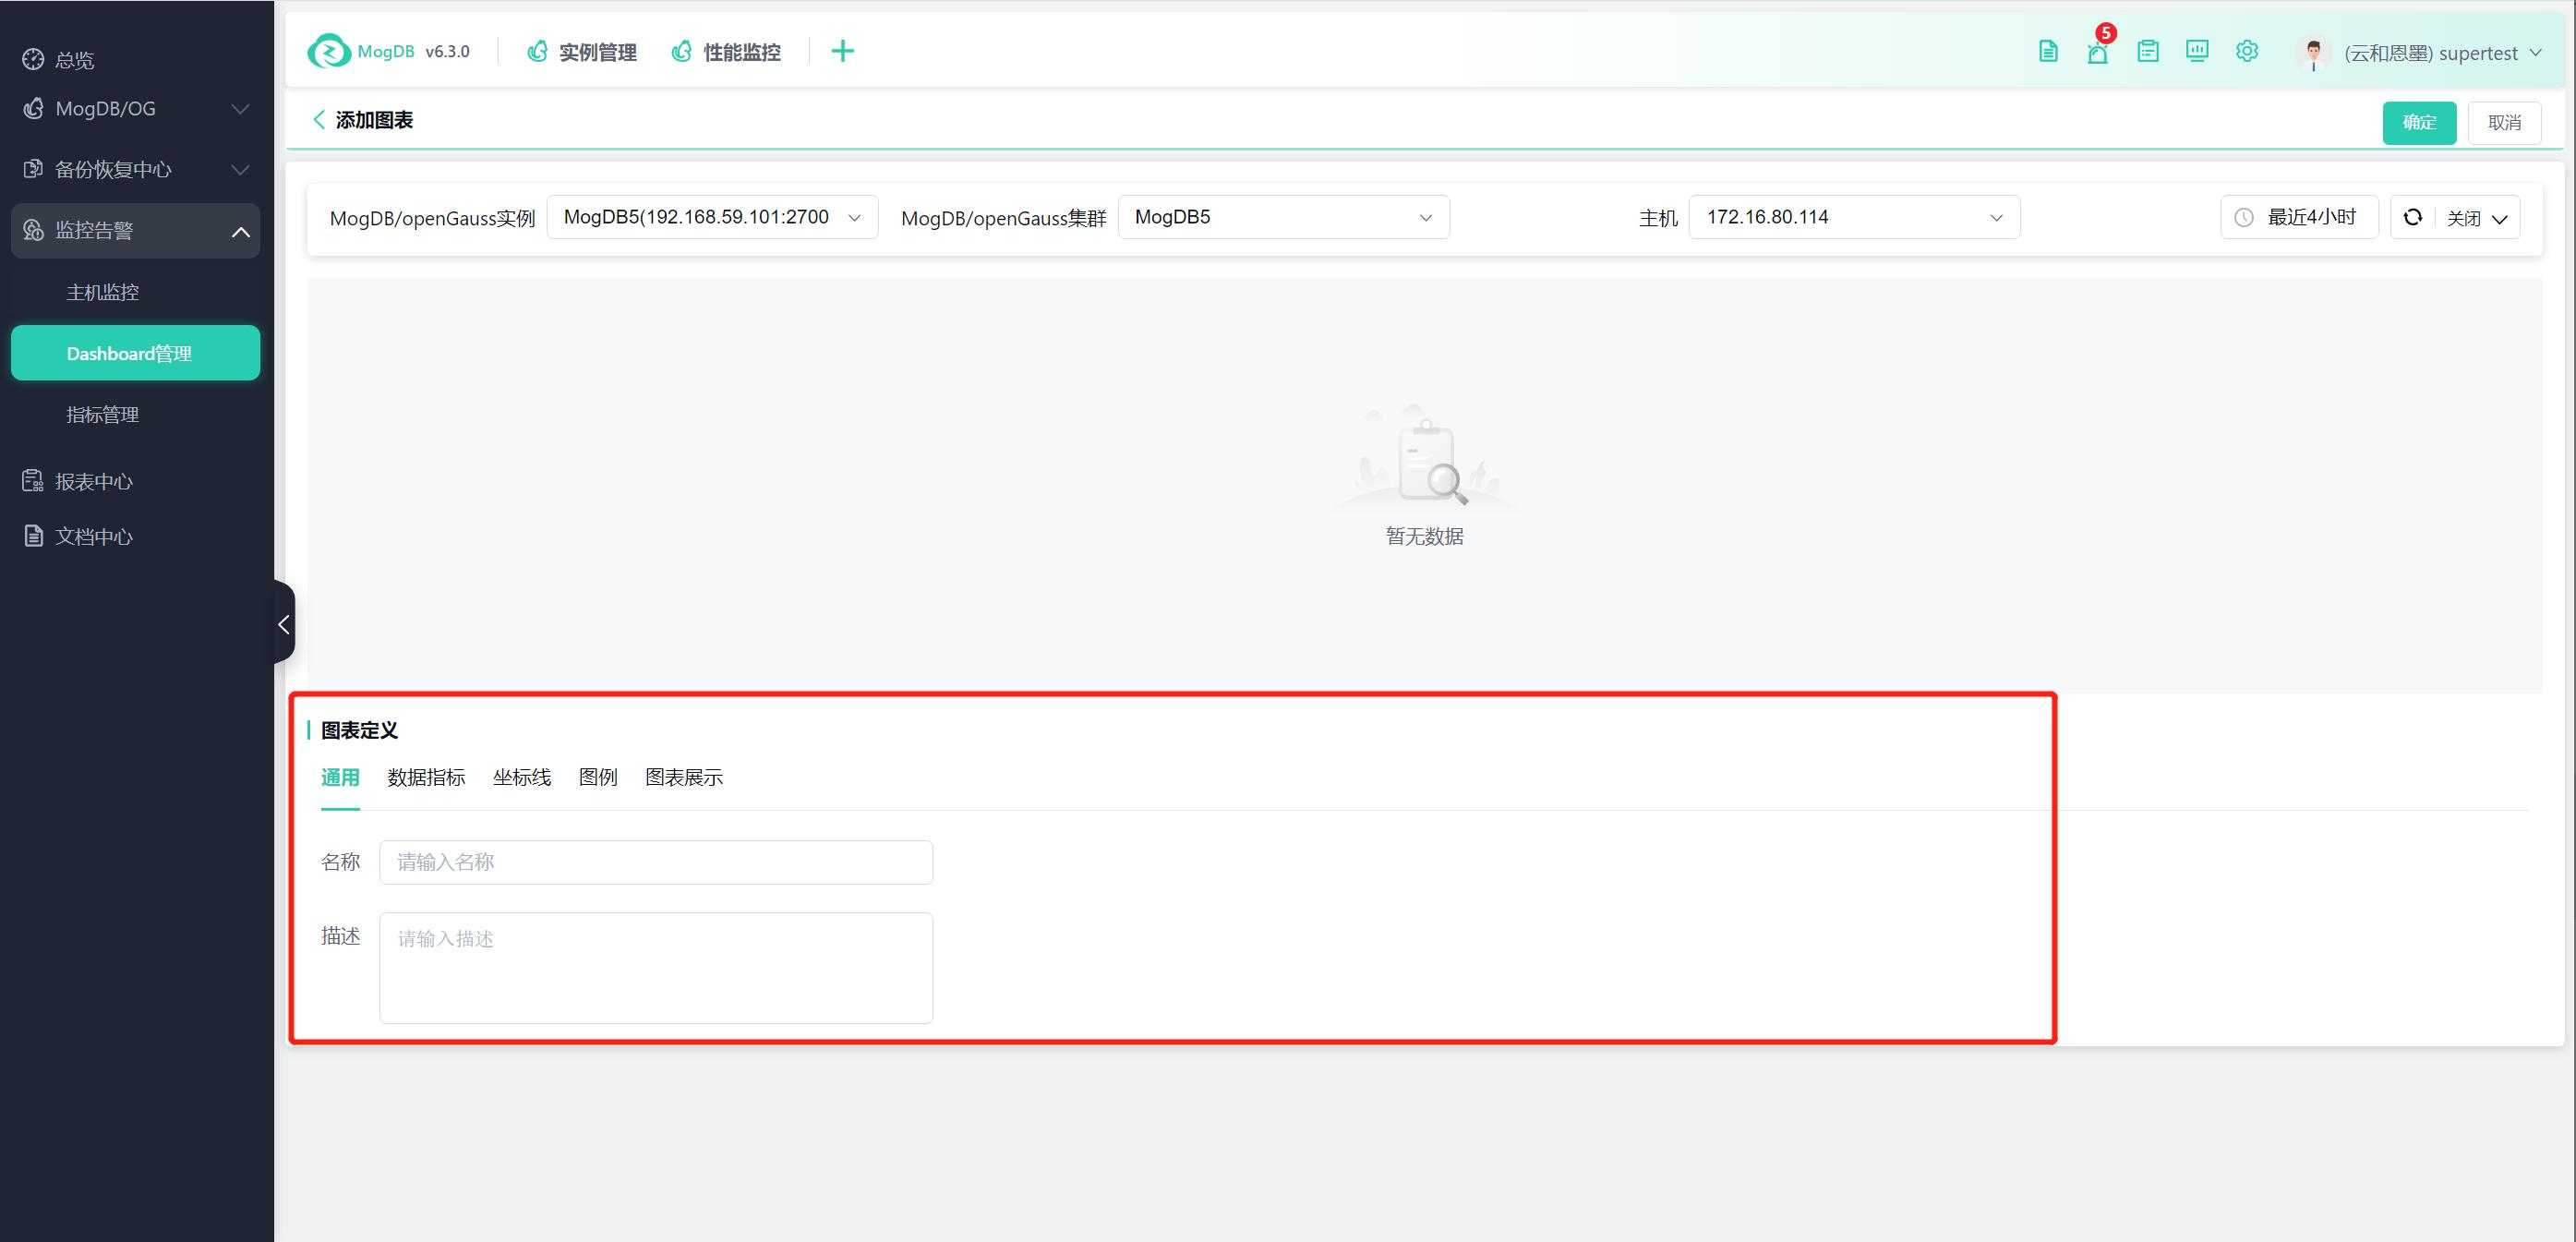
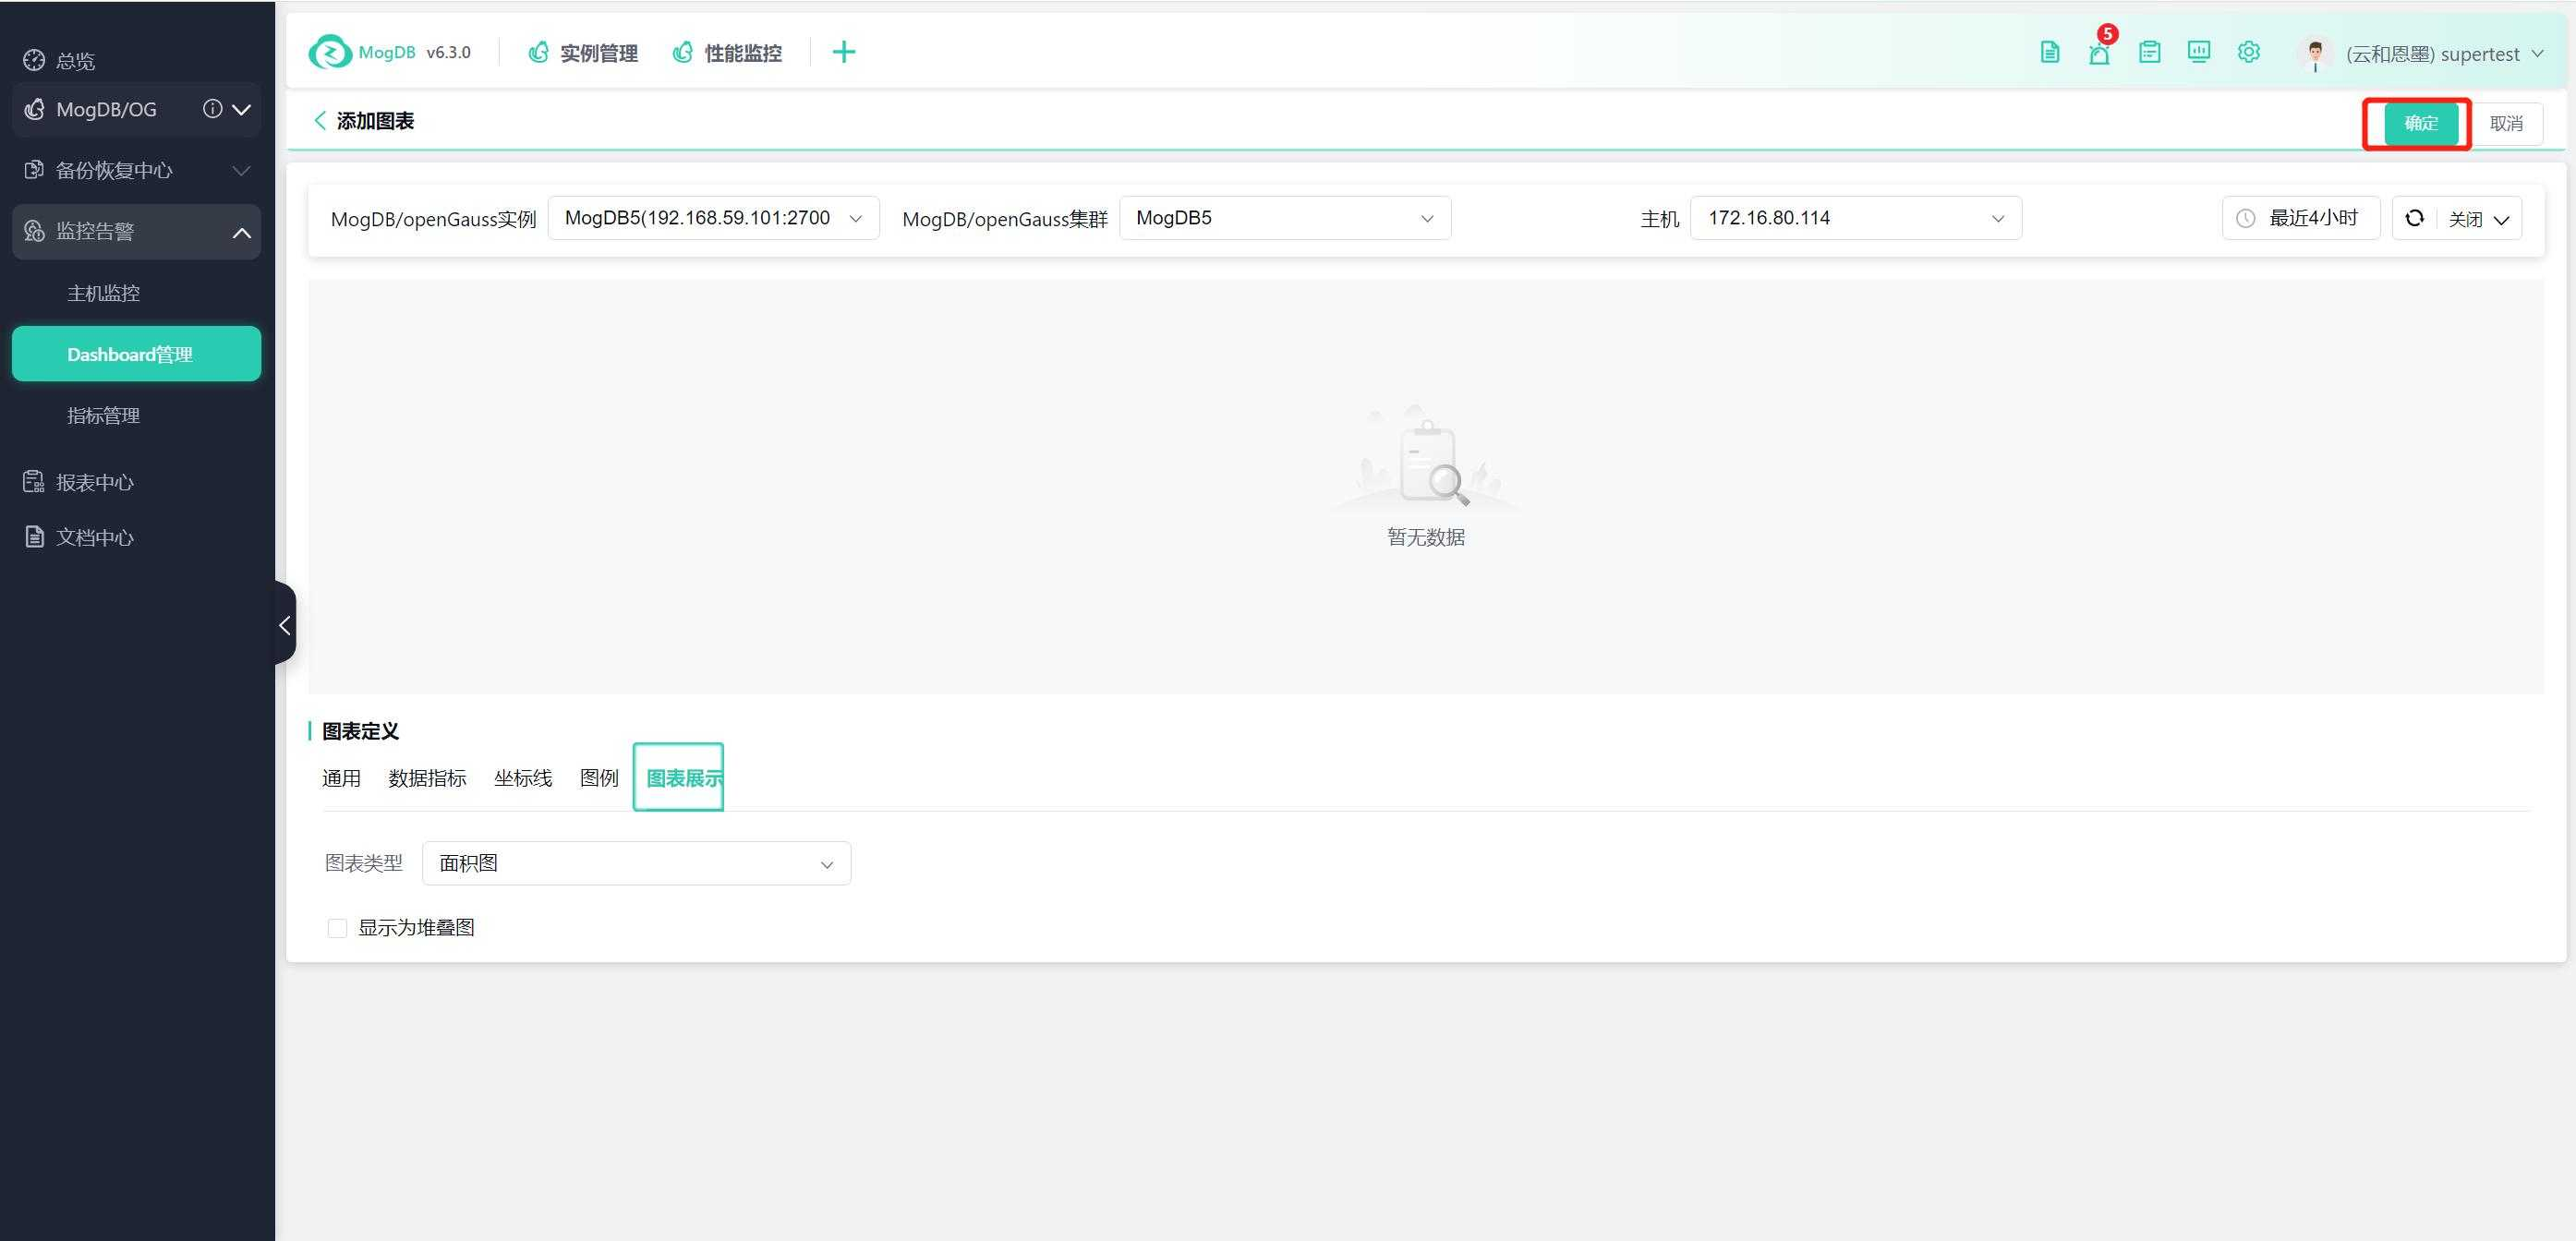
Select the graphical chart to enter the graphical chart customization page.
The instance, database, host, and time period specified at the top indicate the objects from which data is currently extracted for display, used for debugging.
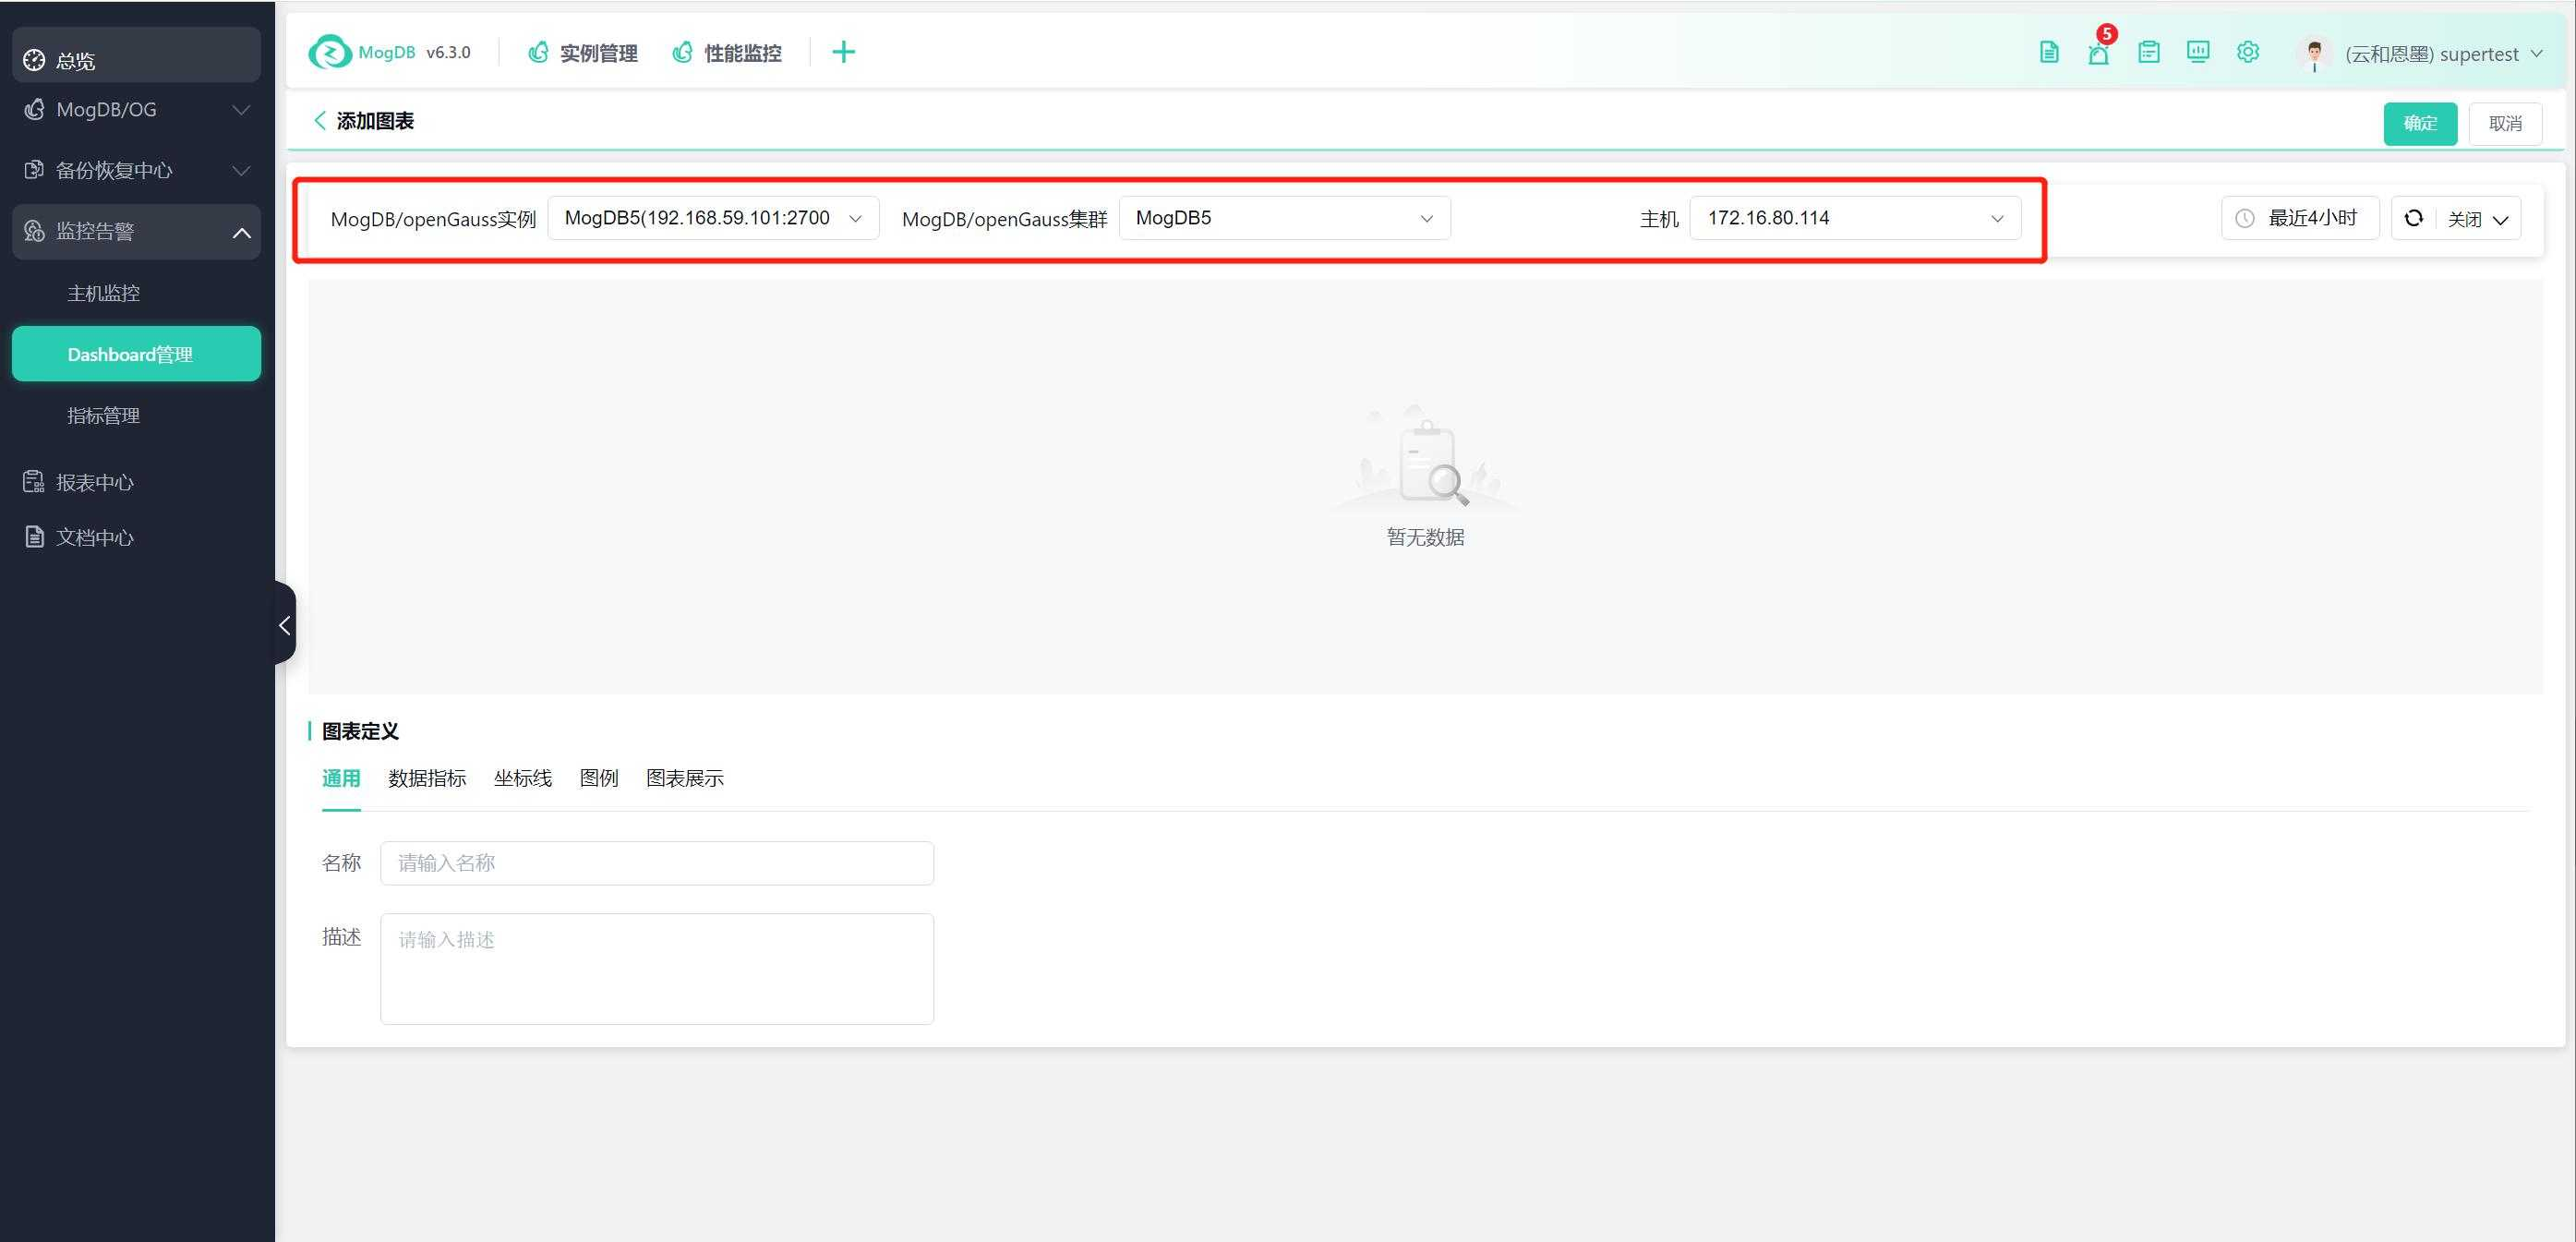
Specify the chart name and description on the common interface.
On the Data Metrics page, specify the details of data collection, and you can choose built-in metrics or customize collection with Prometheus syntax.
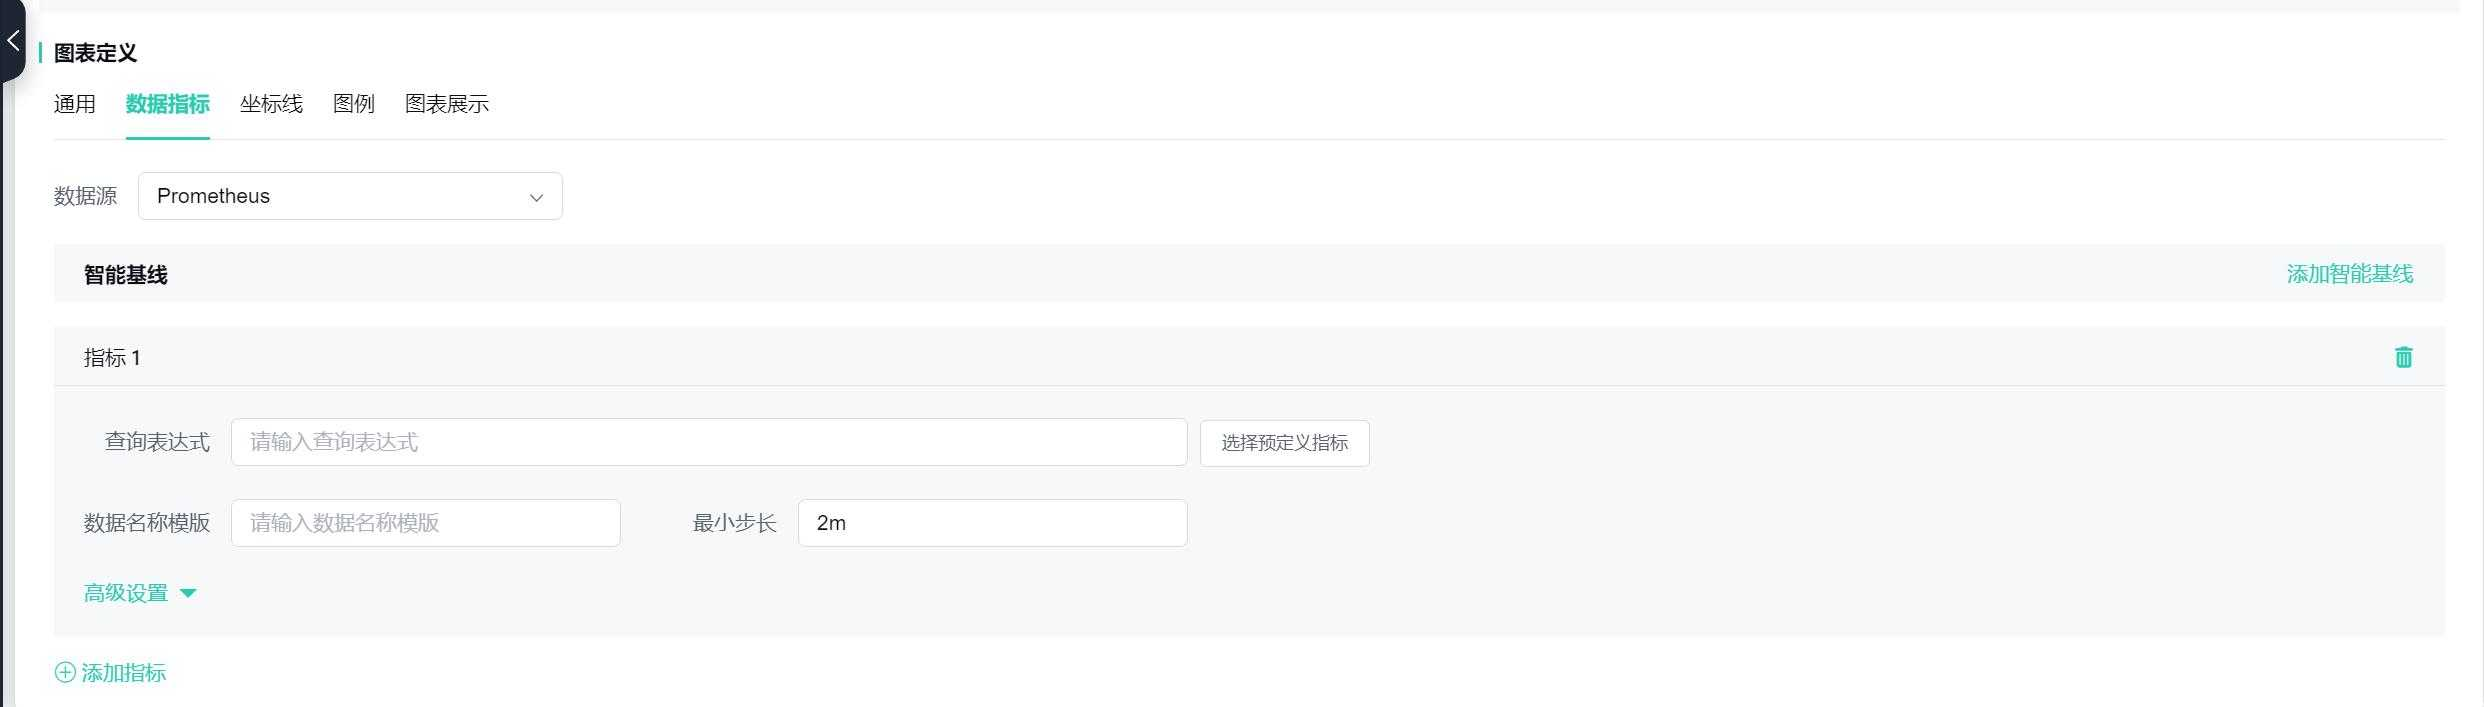
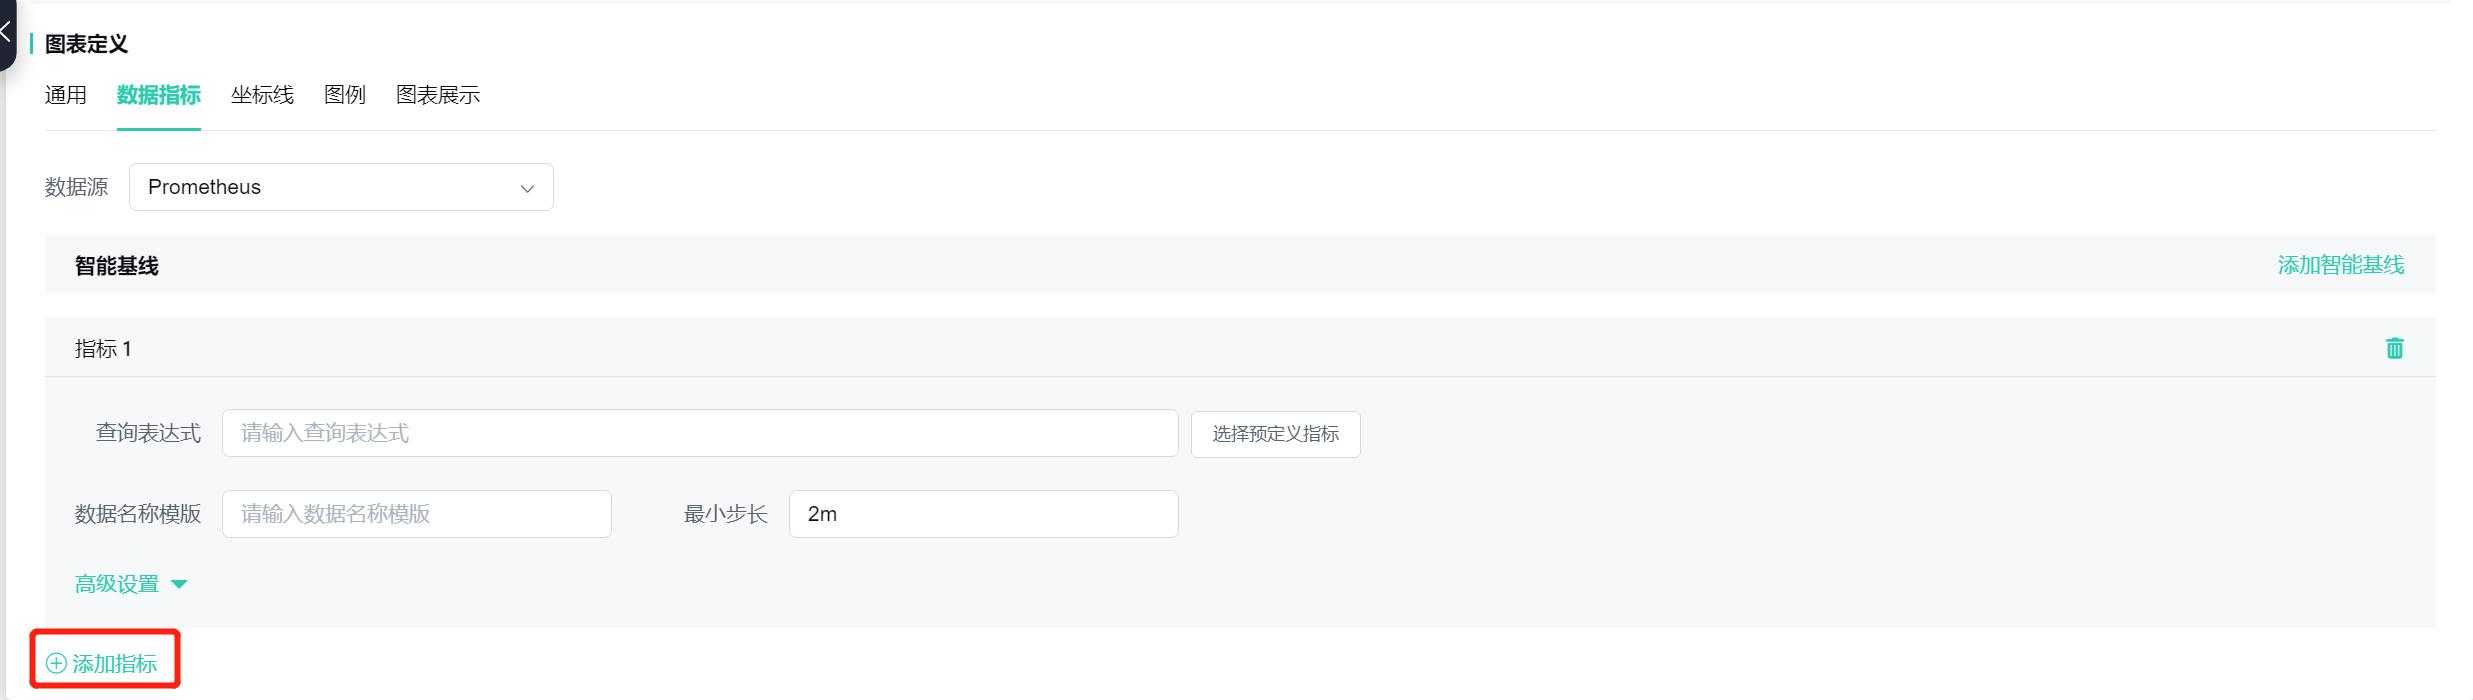
Click the "Add Metric" button to add multiple metrics to the same chart.
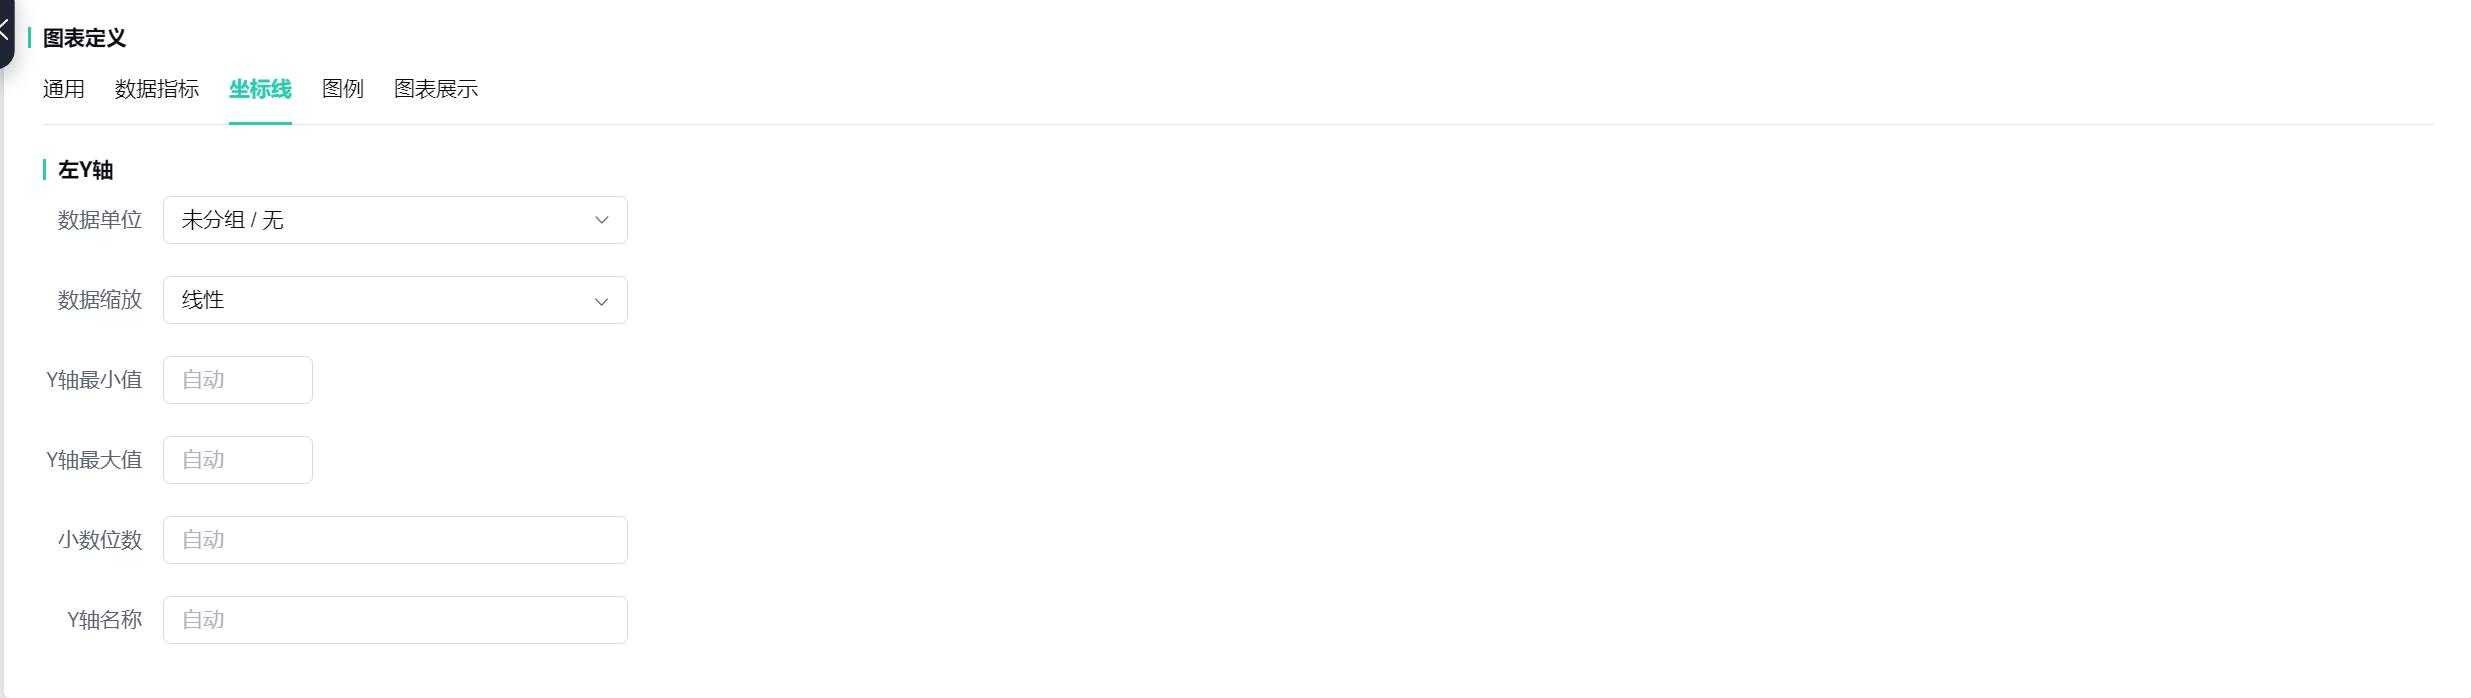
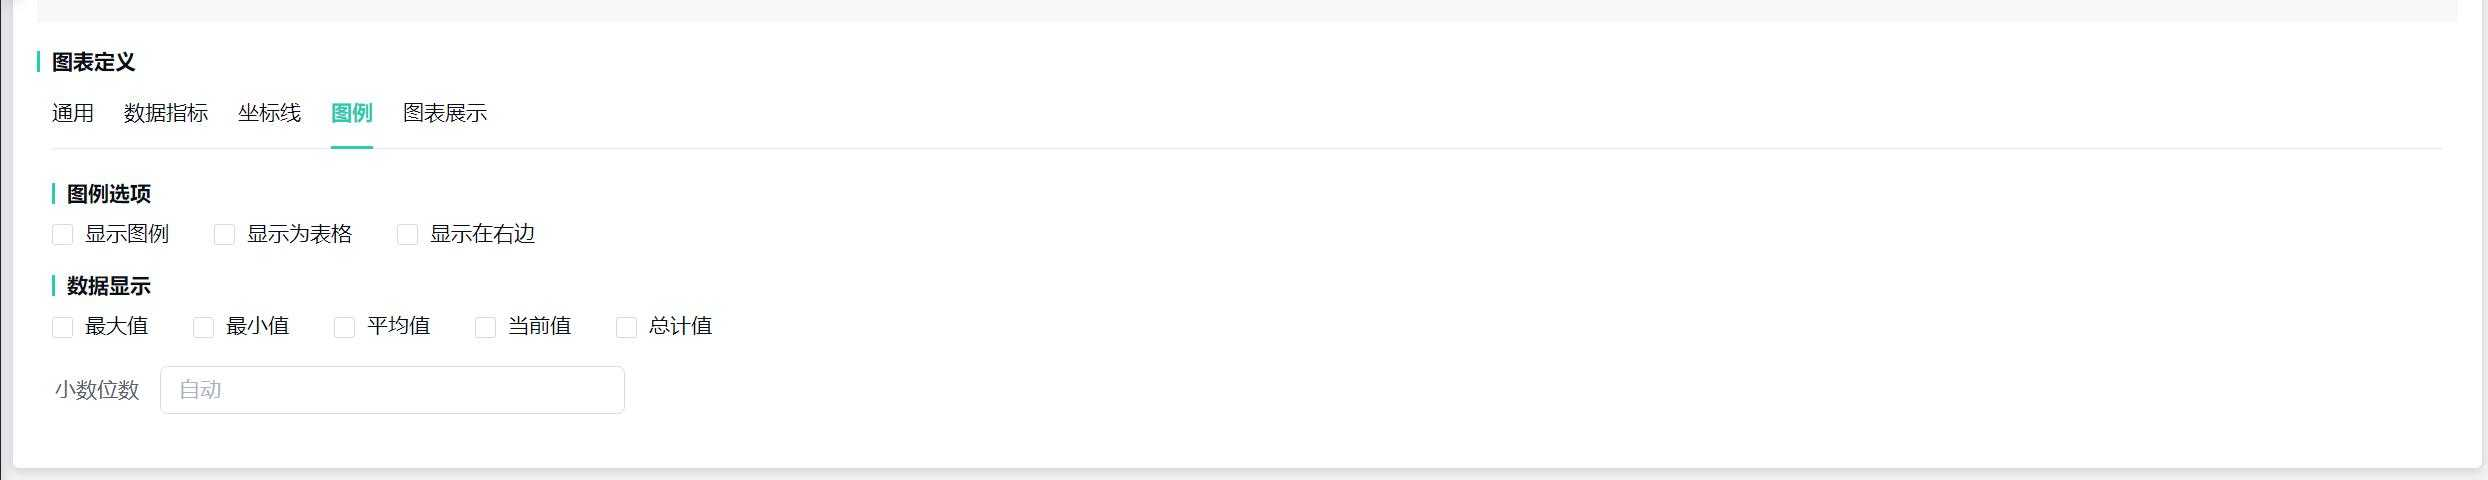
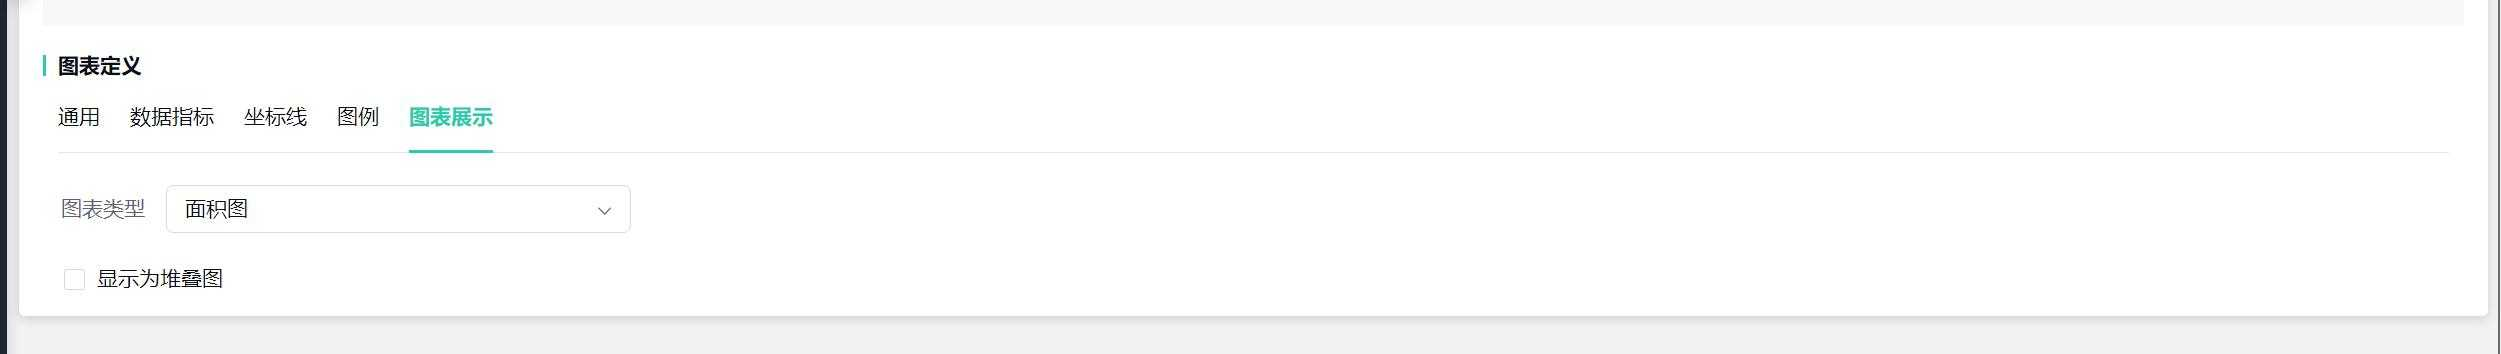
The coordinate axis, legend, and icon display can specify the display method of the graph.
After setting up, click "Confirm" to add the new chart to the dashboard.
Click the "Save" button to save the current chart settings and layout in the dashboard.