- About
- Basic Features
- Introduction
- Platform Tenant Management
- Platform User Management
- TOTP Certification
- Basic Data Definition
- Media Management
- Command Management
- Mail Server Configuration
- Job Center
- Platform Host Resource Pool
- Platform Database Pool
- Platform Proxy Nodes Management
- Platform Components Management
- Additional Information Management
- Operation Log
- Connection Concurrency Configuration
- Customization of Platform Styles
- Parameter Templates
- License
- Monitor Large Screen
- Overview Display
- Tenant User Management
- Tenant Host Resource Pool
- Tenant Proxy Nodes Management
- Menu Management
- Report Center
- MogDB/openGauss
- Backup Recovery Center
- Monitoring
- Alert Center
- Inspect Center
SQL Performance Details
Function Entrance
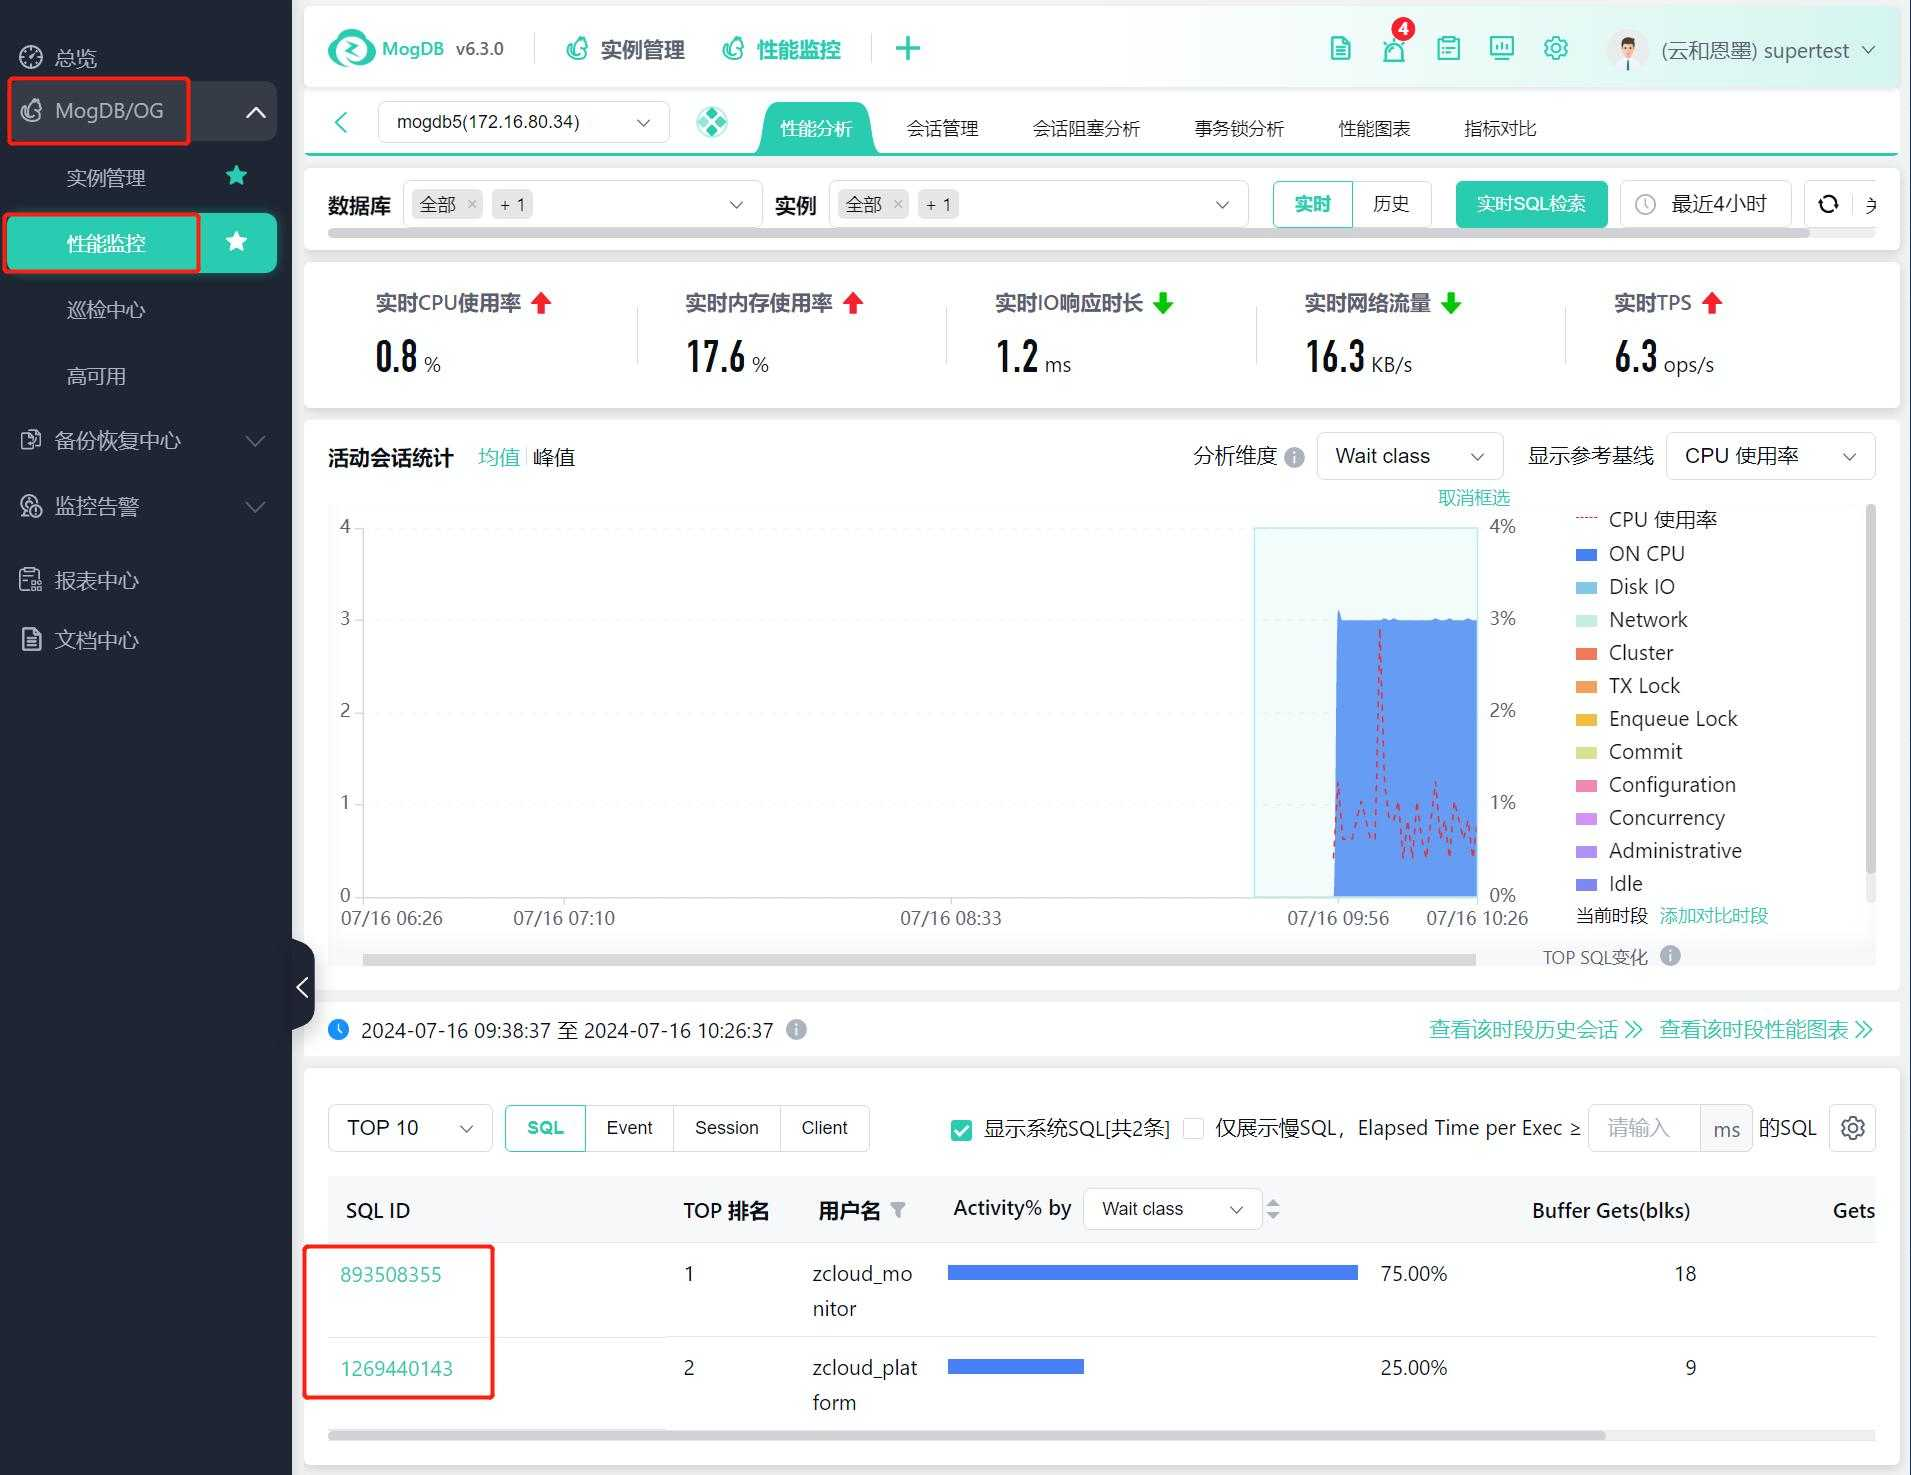
Left-hand function bar MogDB/openGauss --> Performance Monitoring --> Select MogDB/openGauss instance --> Click on any SQL ID to drill down into SQL details
On the MogDB/openGauss database performance detail monitoring page (Performance Trend Top SQL, Historical Top SQL, TOP Sessions, Session Management, Transaction Lock Analysis, Session Block Analysis), you can enter the "SQL Performance Details" page by clicking on any existing SQL ID for SQL performance analysis.
Function Description
By viewing the SQL details, you can understand the detailed information of the SQL statement:
View the details of the SQL statement, execution plan, and related tables and index information.
View the historical performance metrics of the SQL to analyze the performance metrics of each execution plan and the trend of these performance metrics.
Operating Instructions
SQL performance details can be viewed in real-time data and historical data on separate detail pages, divided into execution plans and performance data:
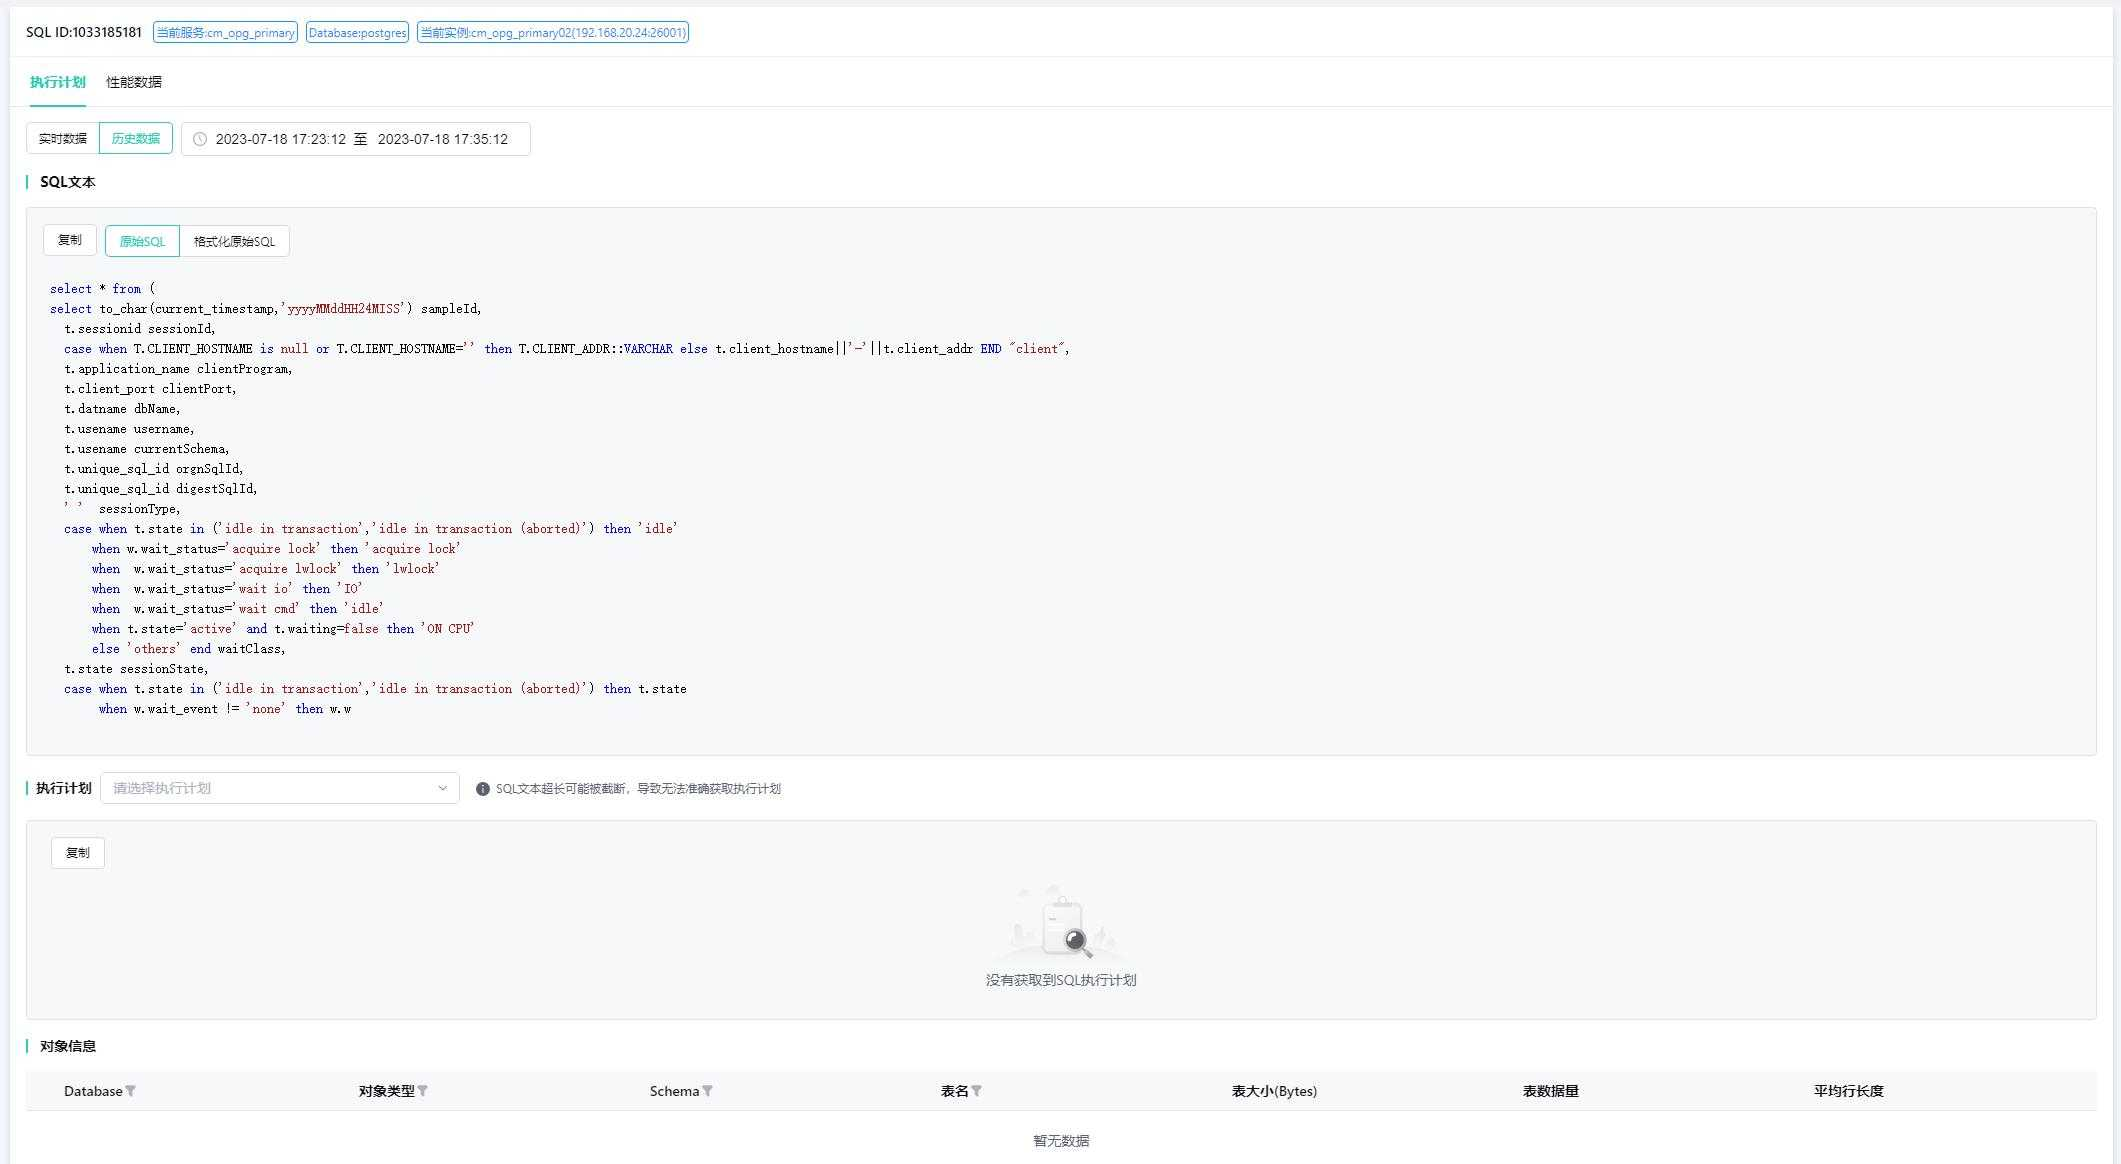
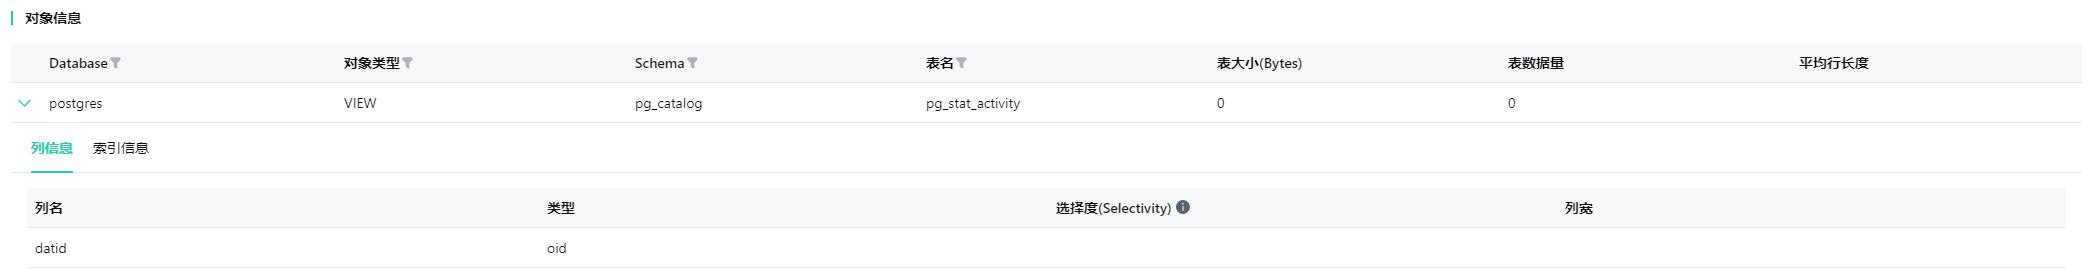
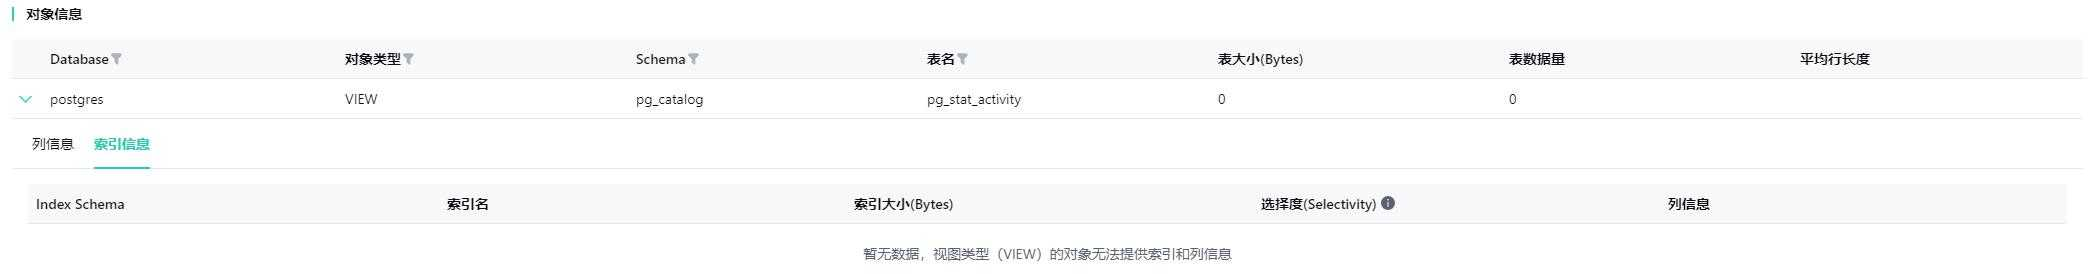
Under the execution plan, it includes the display of SQL text and the first-level related object information of the corresponding execution plan (tables, indexes, etc.).
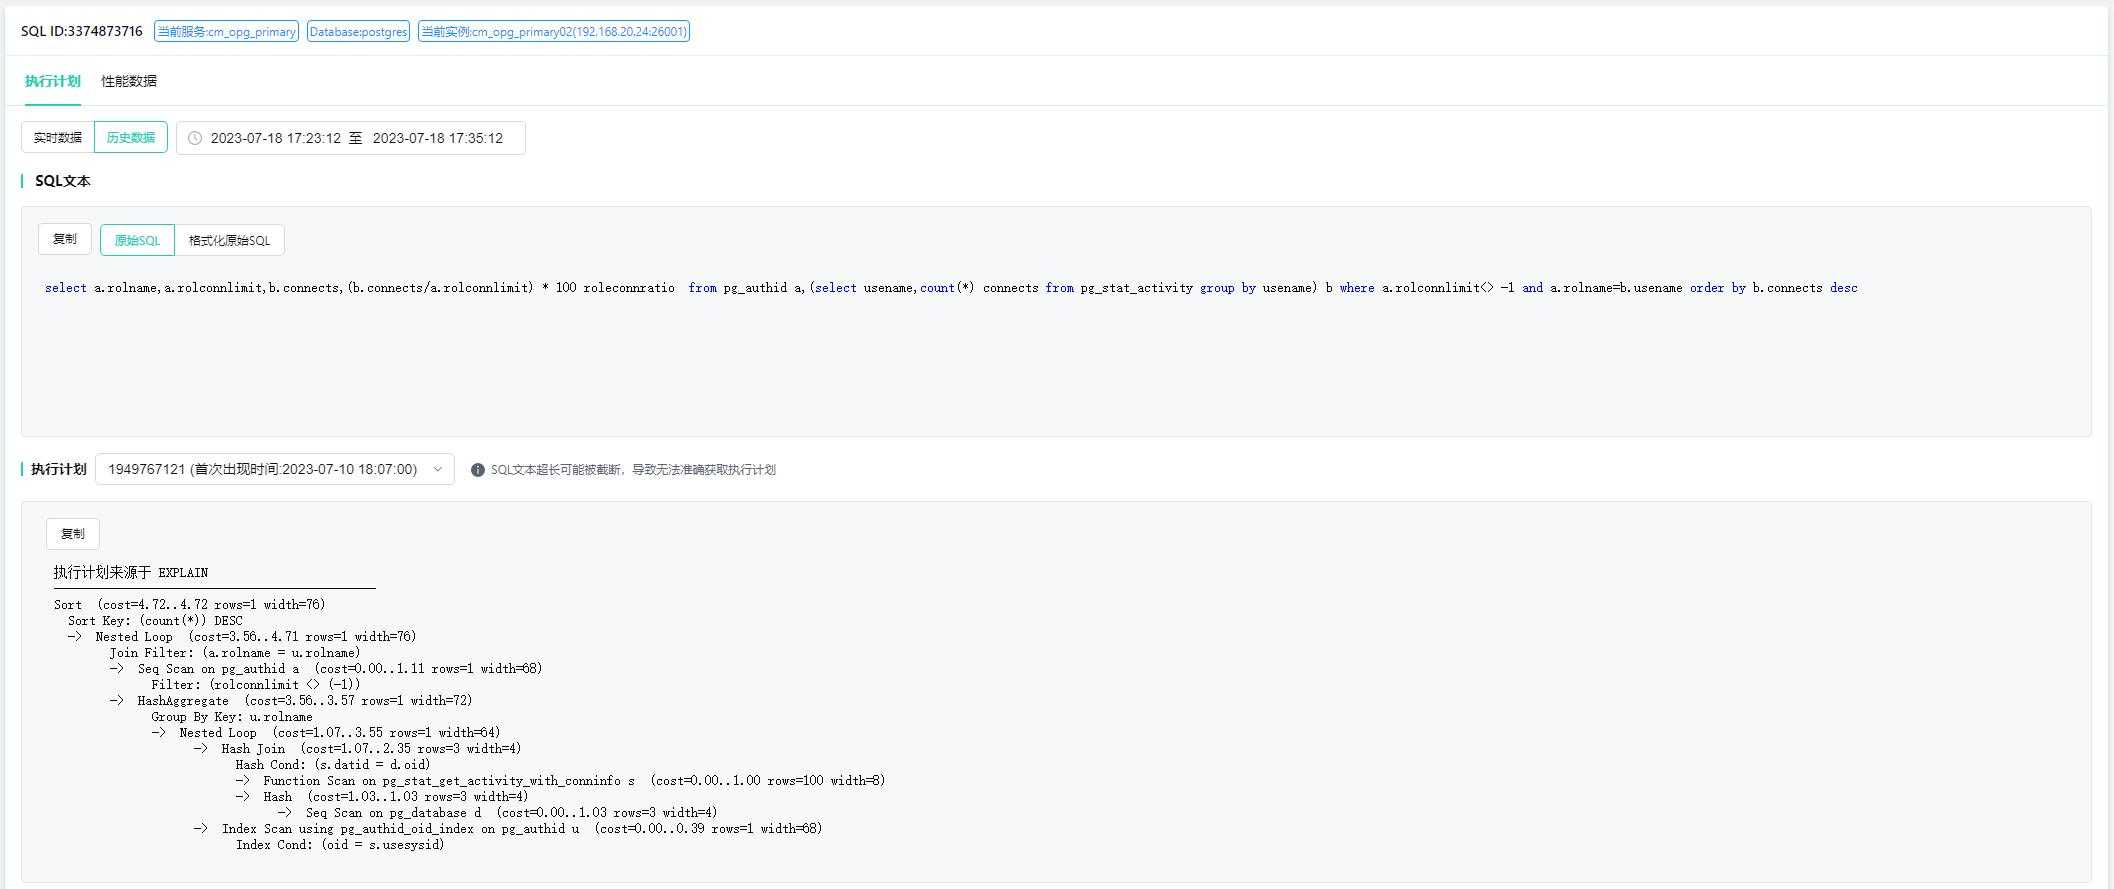
Object Information
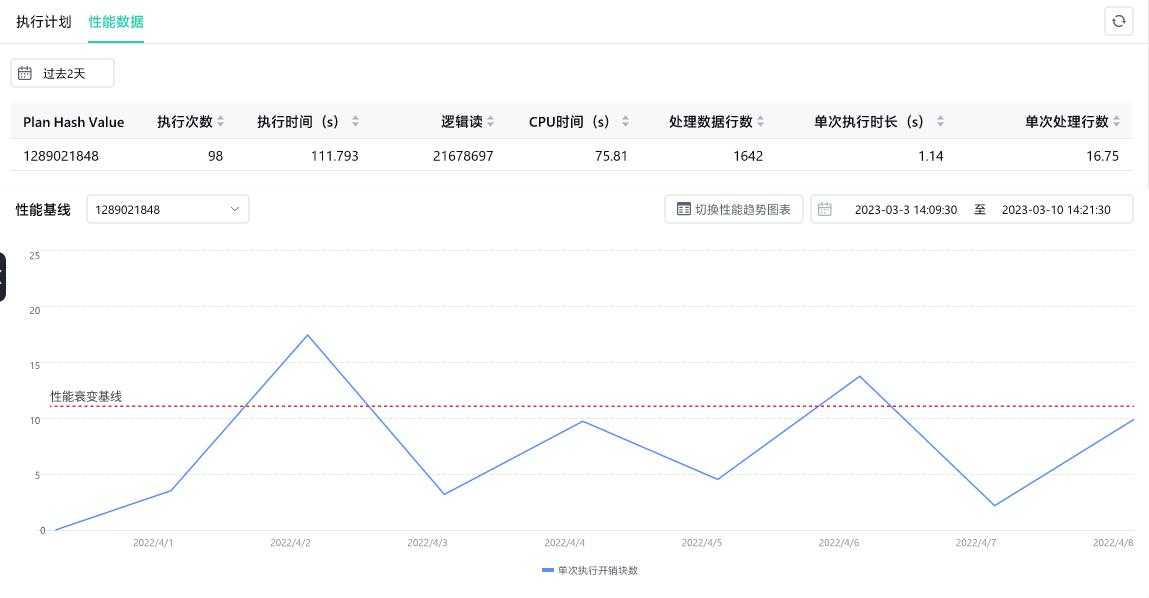
Under performance data, it displays the performance charts and performance trend charts of the execution plan. The performance trend chart supports selecting indicators to display in the chart, with a maximum of 20 indicators selected at a time. It shows the maximum, minimum, and average values of the selected indicators.
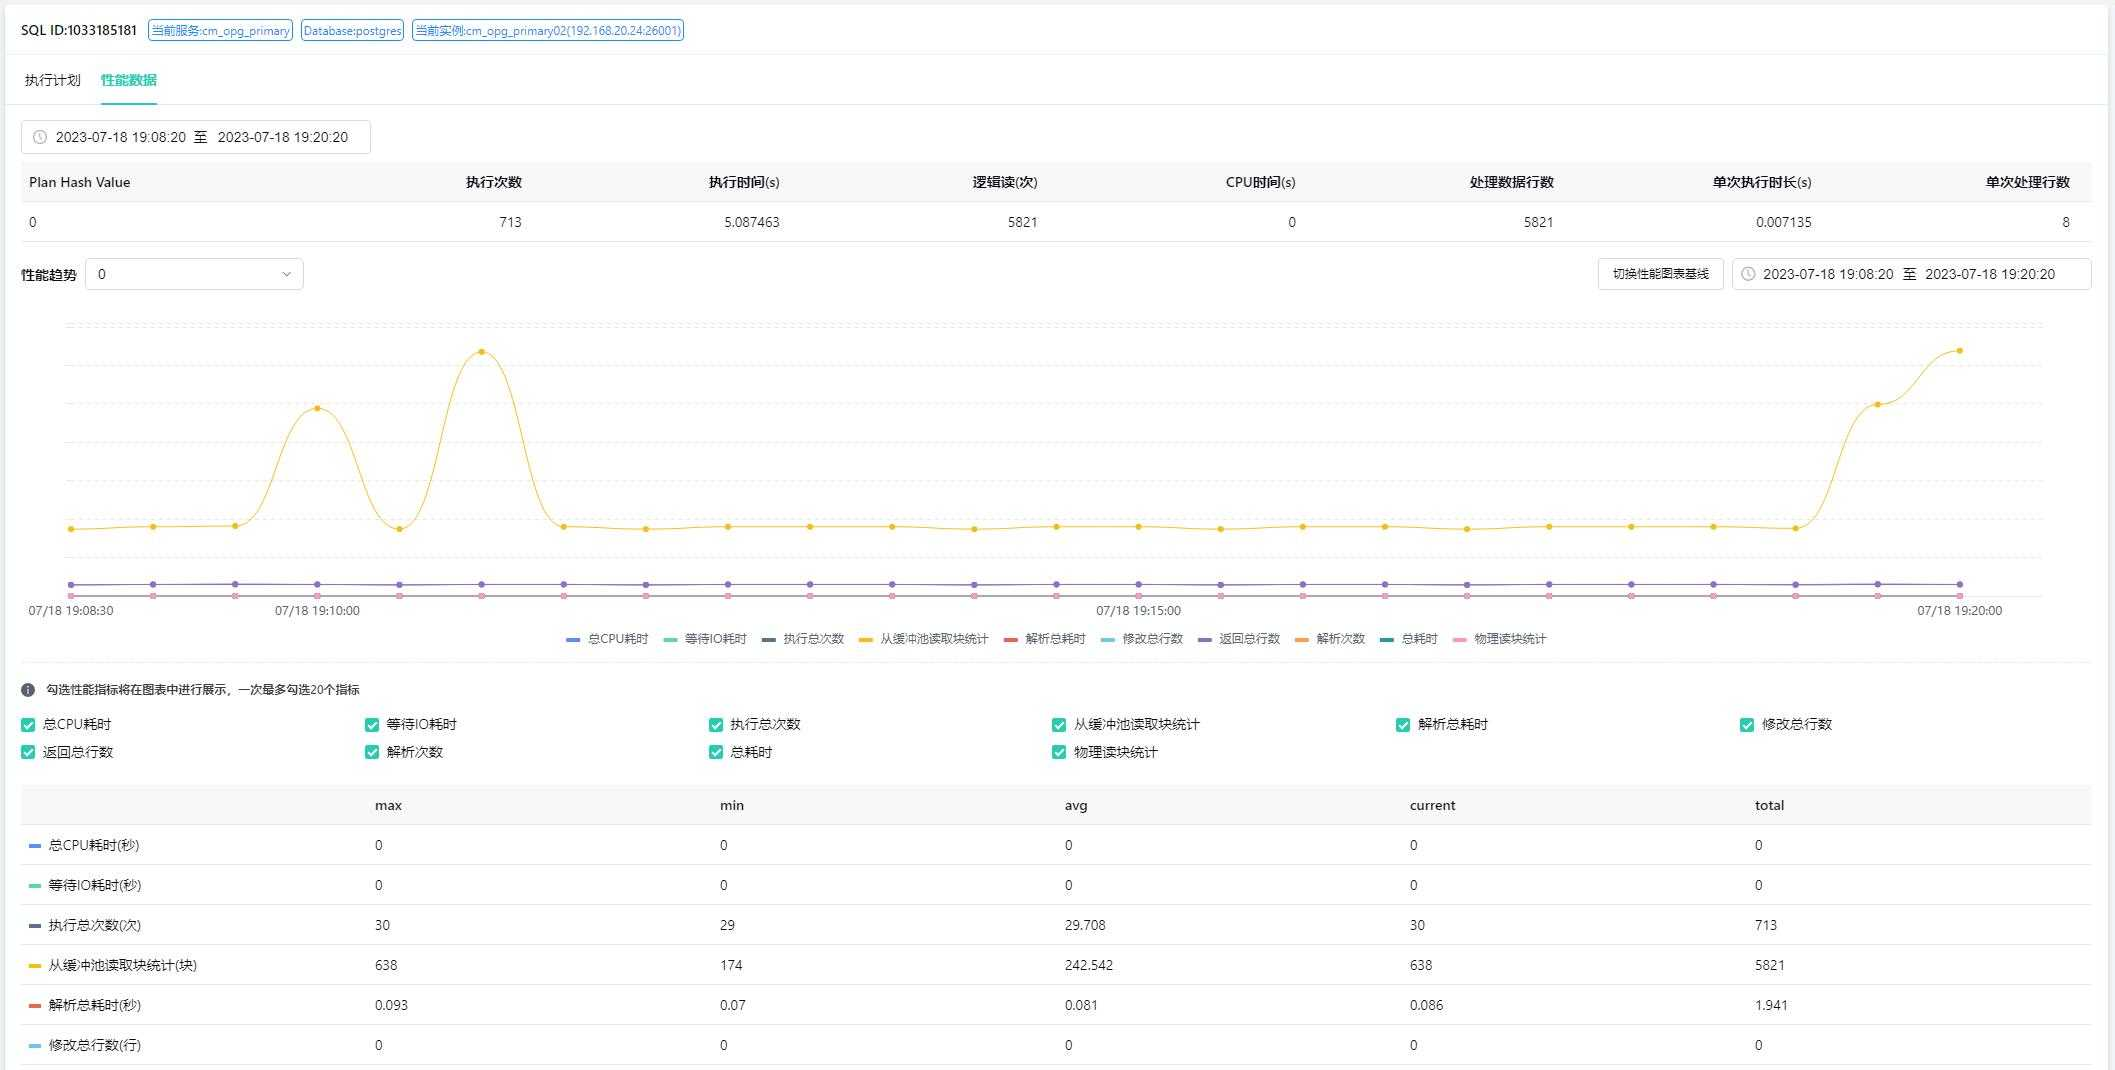
Support for switching performance baseline charts.