- About
- Basic Features
- Introduction
- Platform Tenant Management
- Platform User Management
- TOTP Certification
- Basic Data Definition
- Media Management
- Command Management
- Mail Server Configuration
- Job Center
- Platform Host Resource Pool
- Platform Database Pool
- Platform Proxy Nodes Management
- Platform Components Management
- Additional Information Management
- Operation Log
- Connection Concurrency Configuration
- Customization of Platform Styles
- Parameter Templates
- License
- Monitor Large Screen
- Overview Display
- Tenant User Management
- Tenant Host Resource Pool
- Tenant Proxy Nodes Management
- Menu Management
- Report Center
- MogDB/openGauss
- Backup Recovery Center
- Monitoring
- Alert Center
- Inspect Center
Metrics Management
Function Entrance
Monitor Alerts --> Metrics Management
Function Description
- View the platform's predefined collection metrics.
- Create, modify, and delete custom SQL/SHELL collection database metrics, which are collected by the platform through Prometheus.
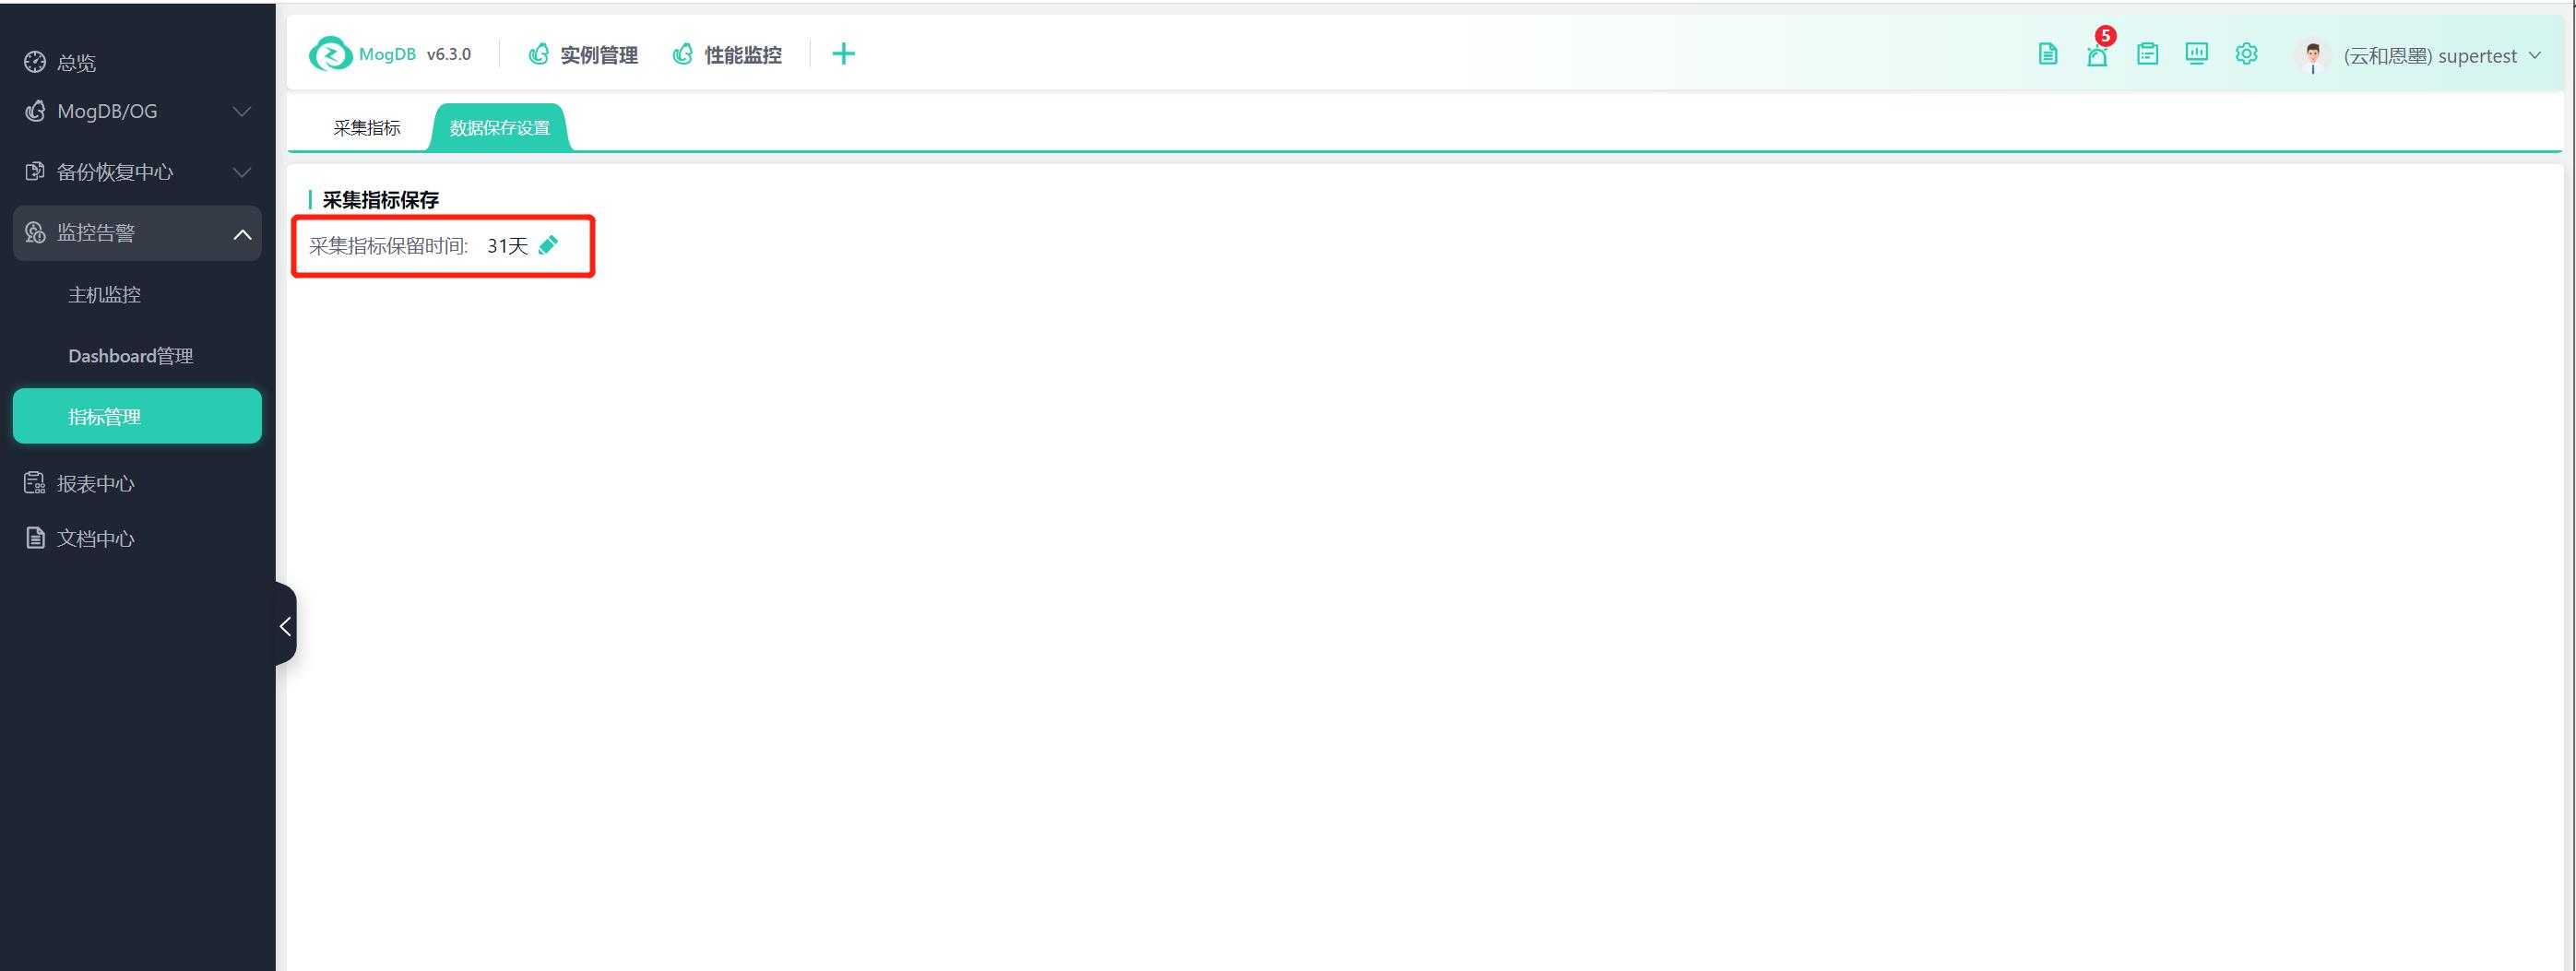
- Set the retention period for collection metrics.
Operating Instructions
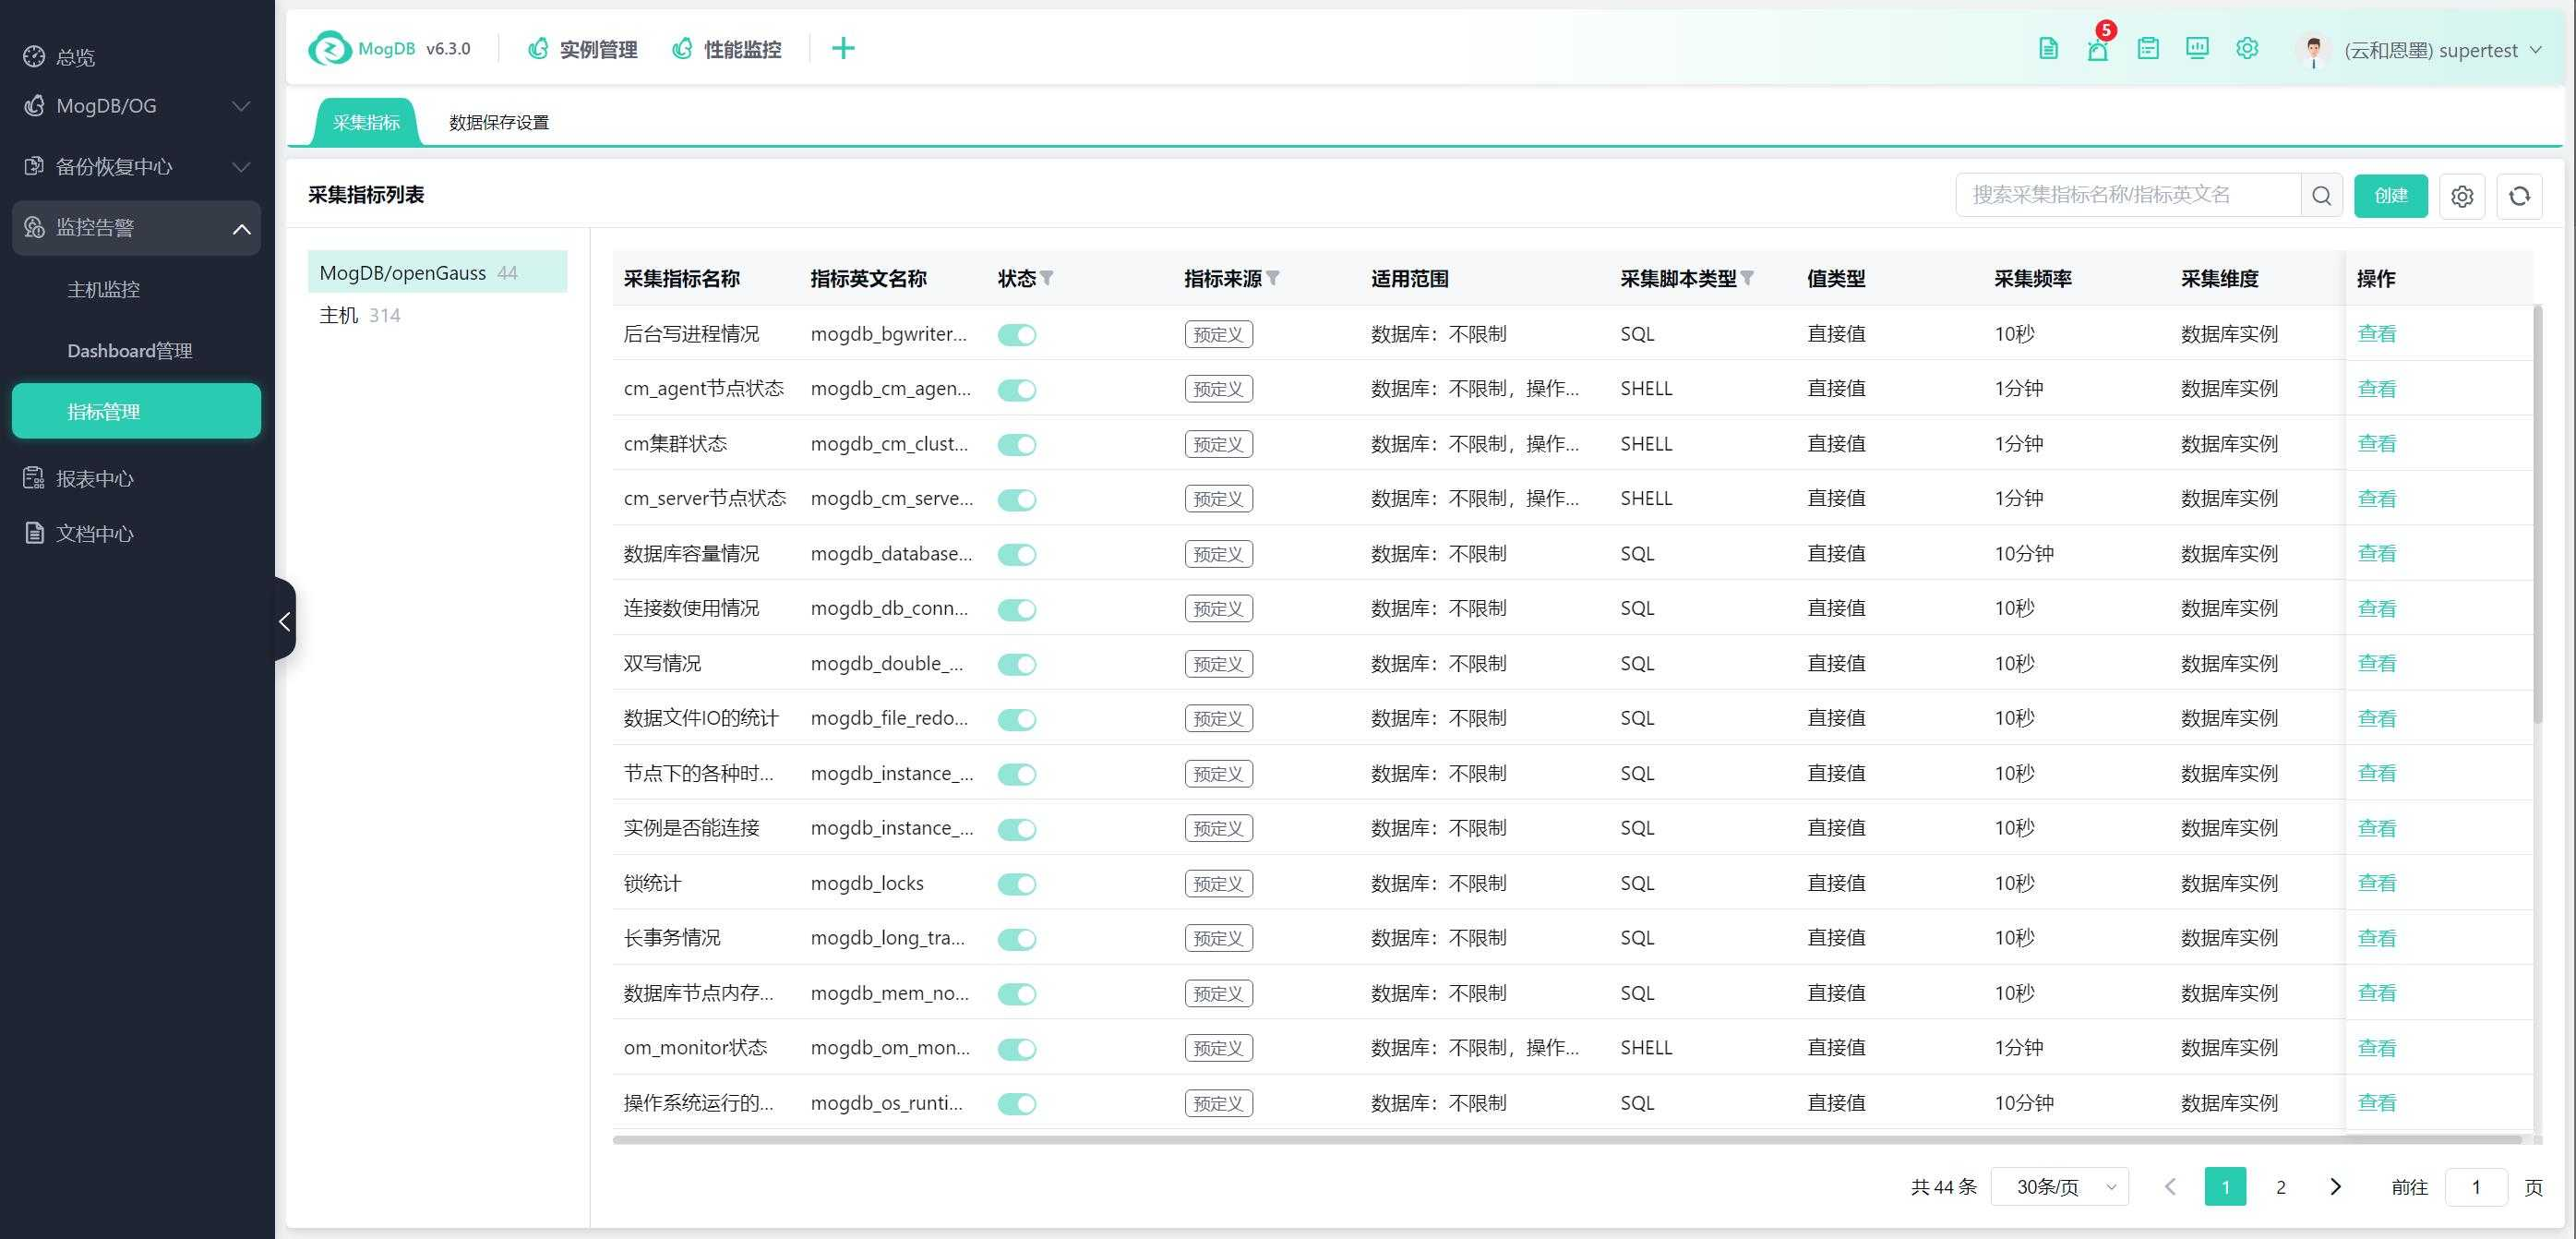
Collection Metrics List
The collection metrics list page displays various database types and host collection metrics currently available on the platform. The left-hand menu allows you to click and switch between views. The number after the name represents the quantity of collection metrics for that type.
The source field can distinguish whether the collection metric is predefined by the platform or created by the user. Predefined metrics can only be viewed and cannot be edited, deleted, or disabled.
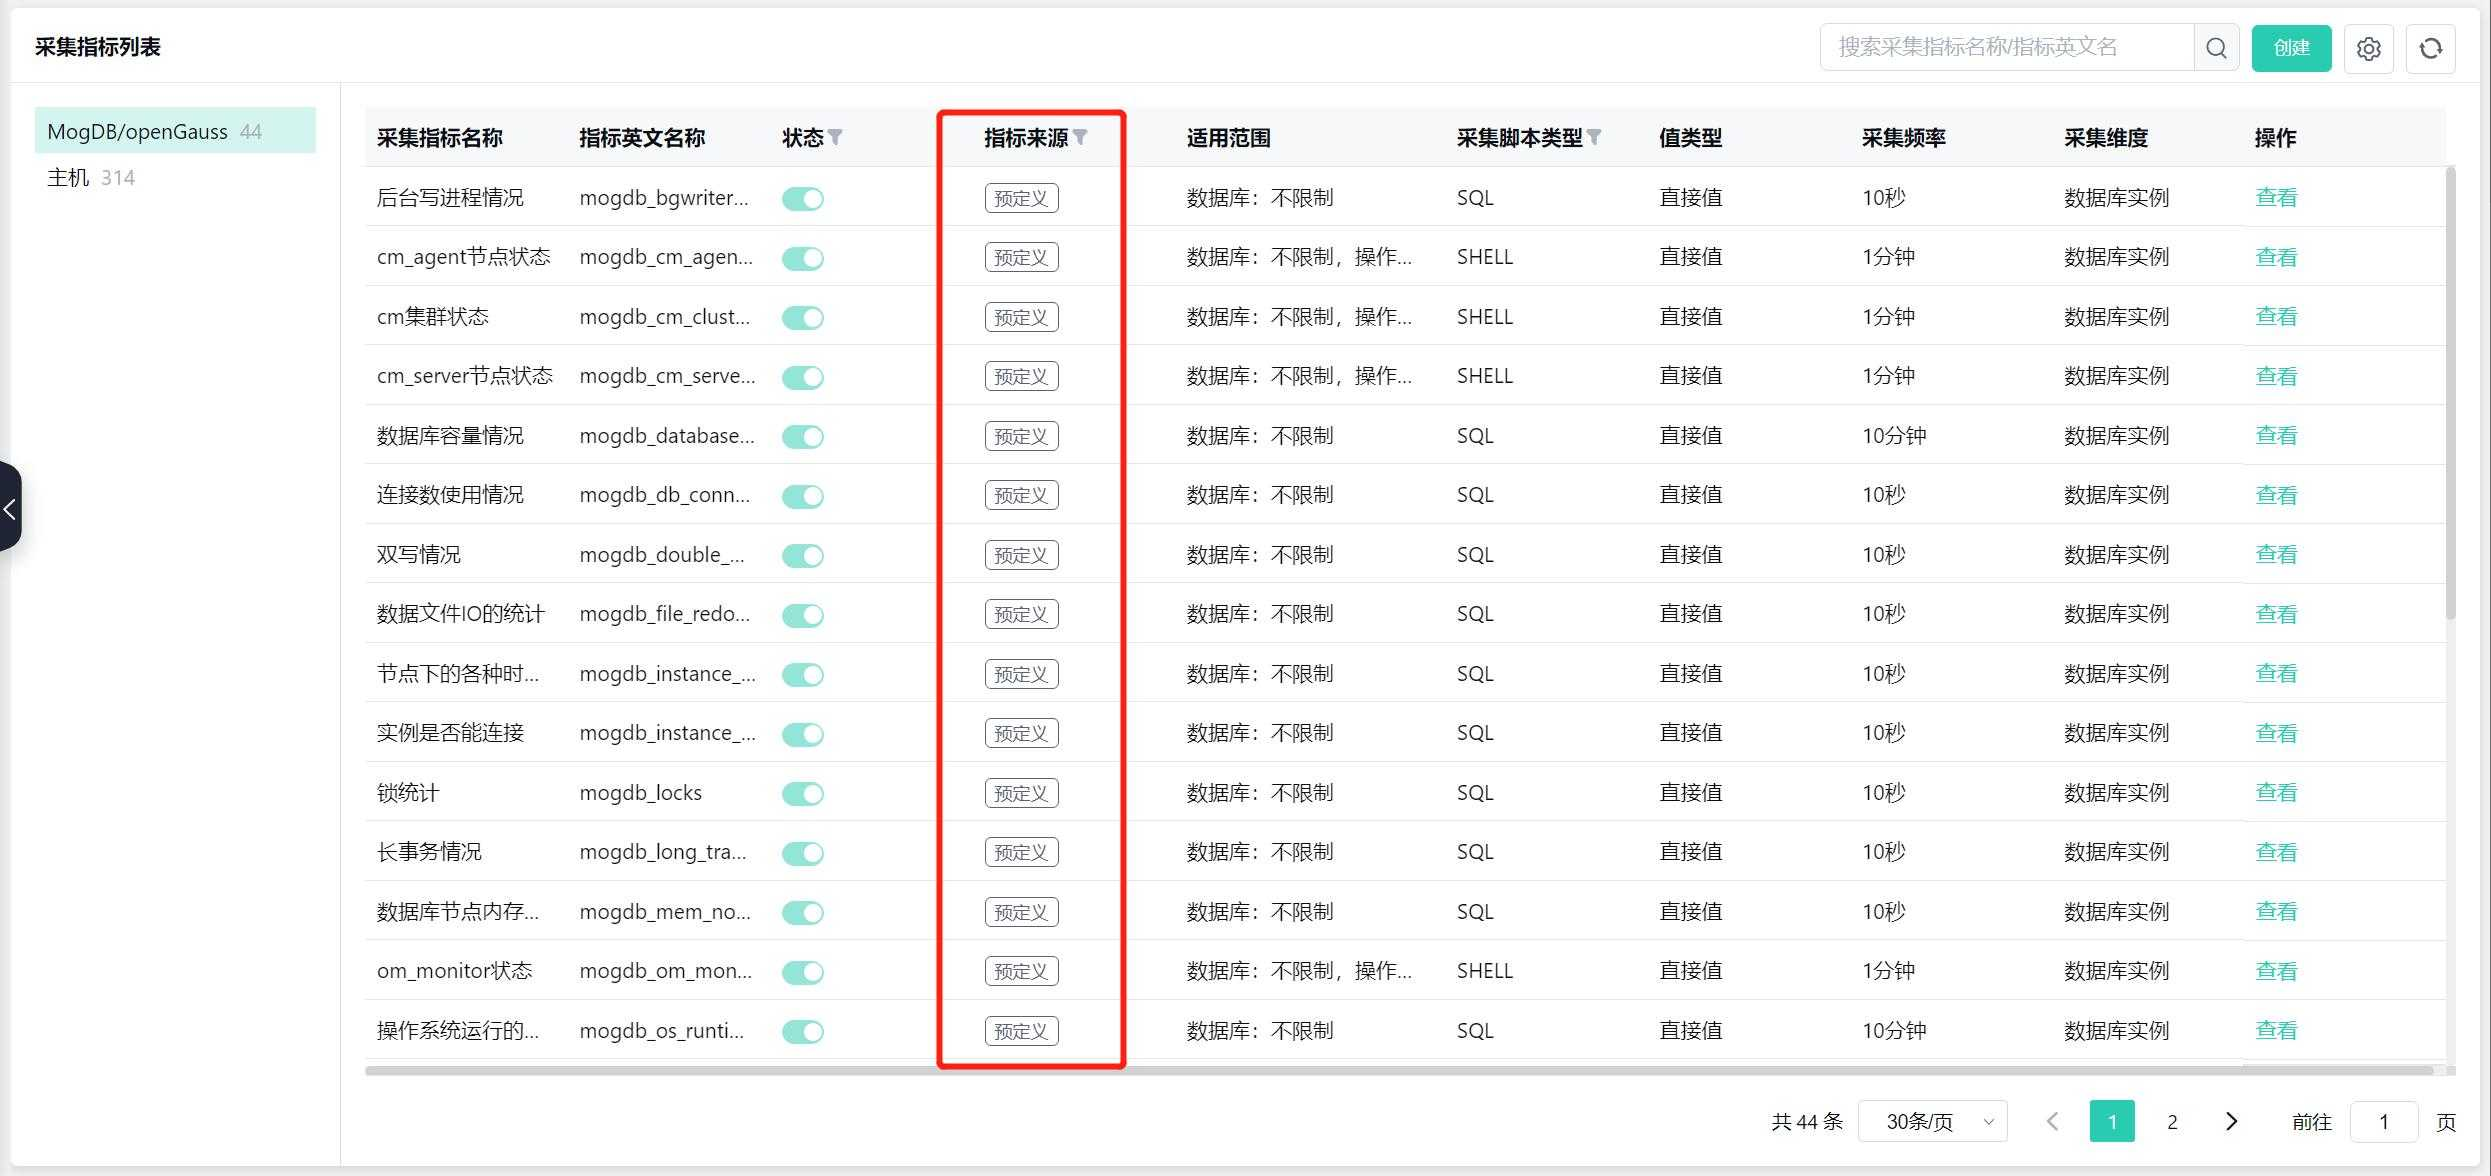
Custom metrics support disabling, modifying, and deleting. These operations may cause the configured alerts and monitoring functions to fail, please proceed with caution!
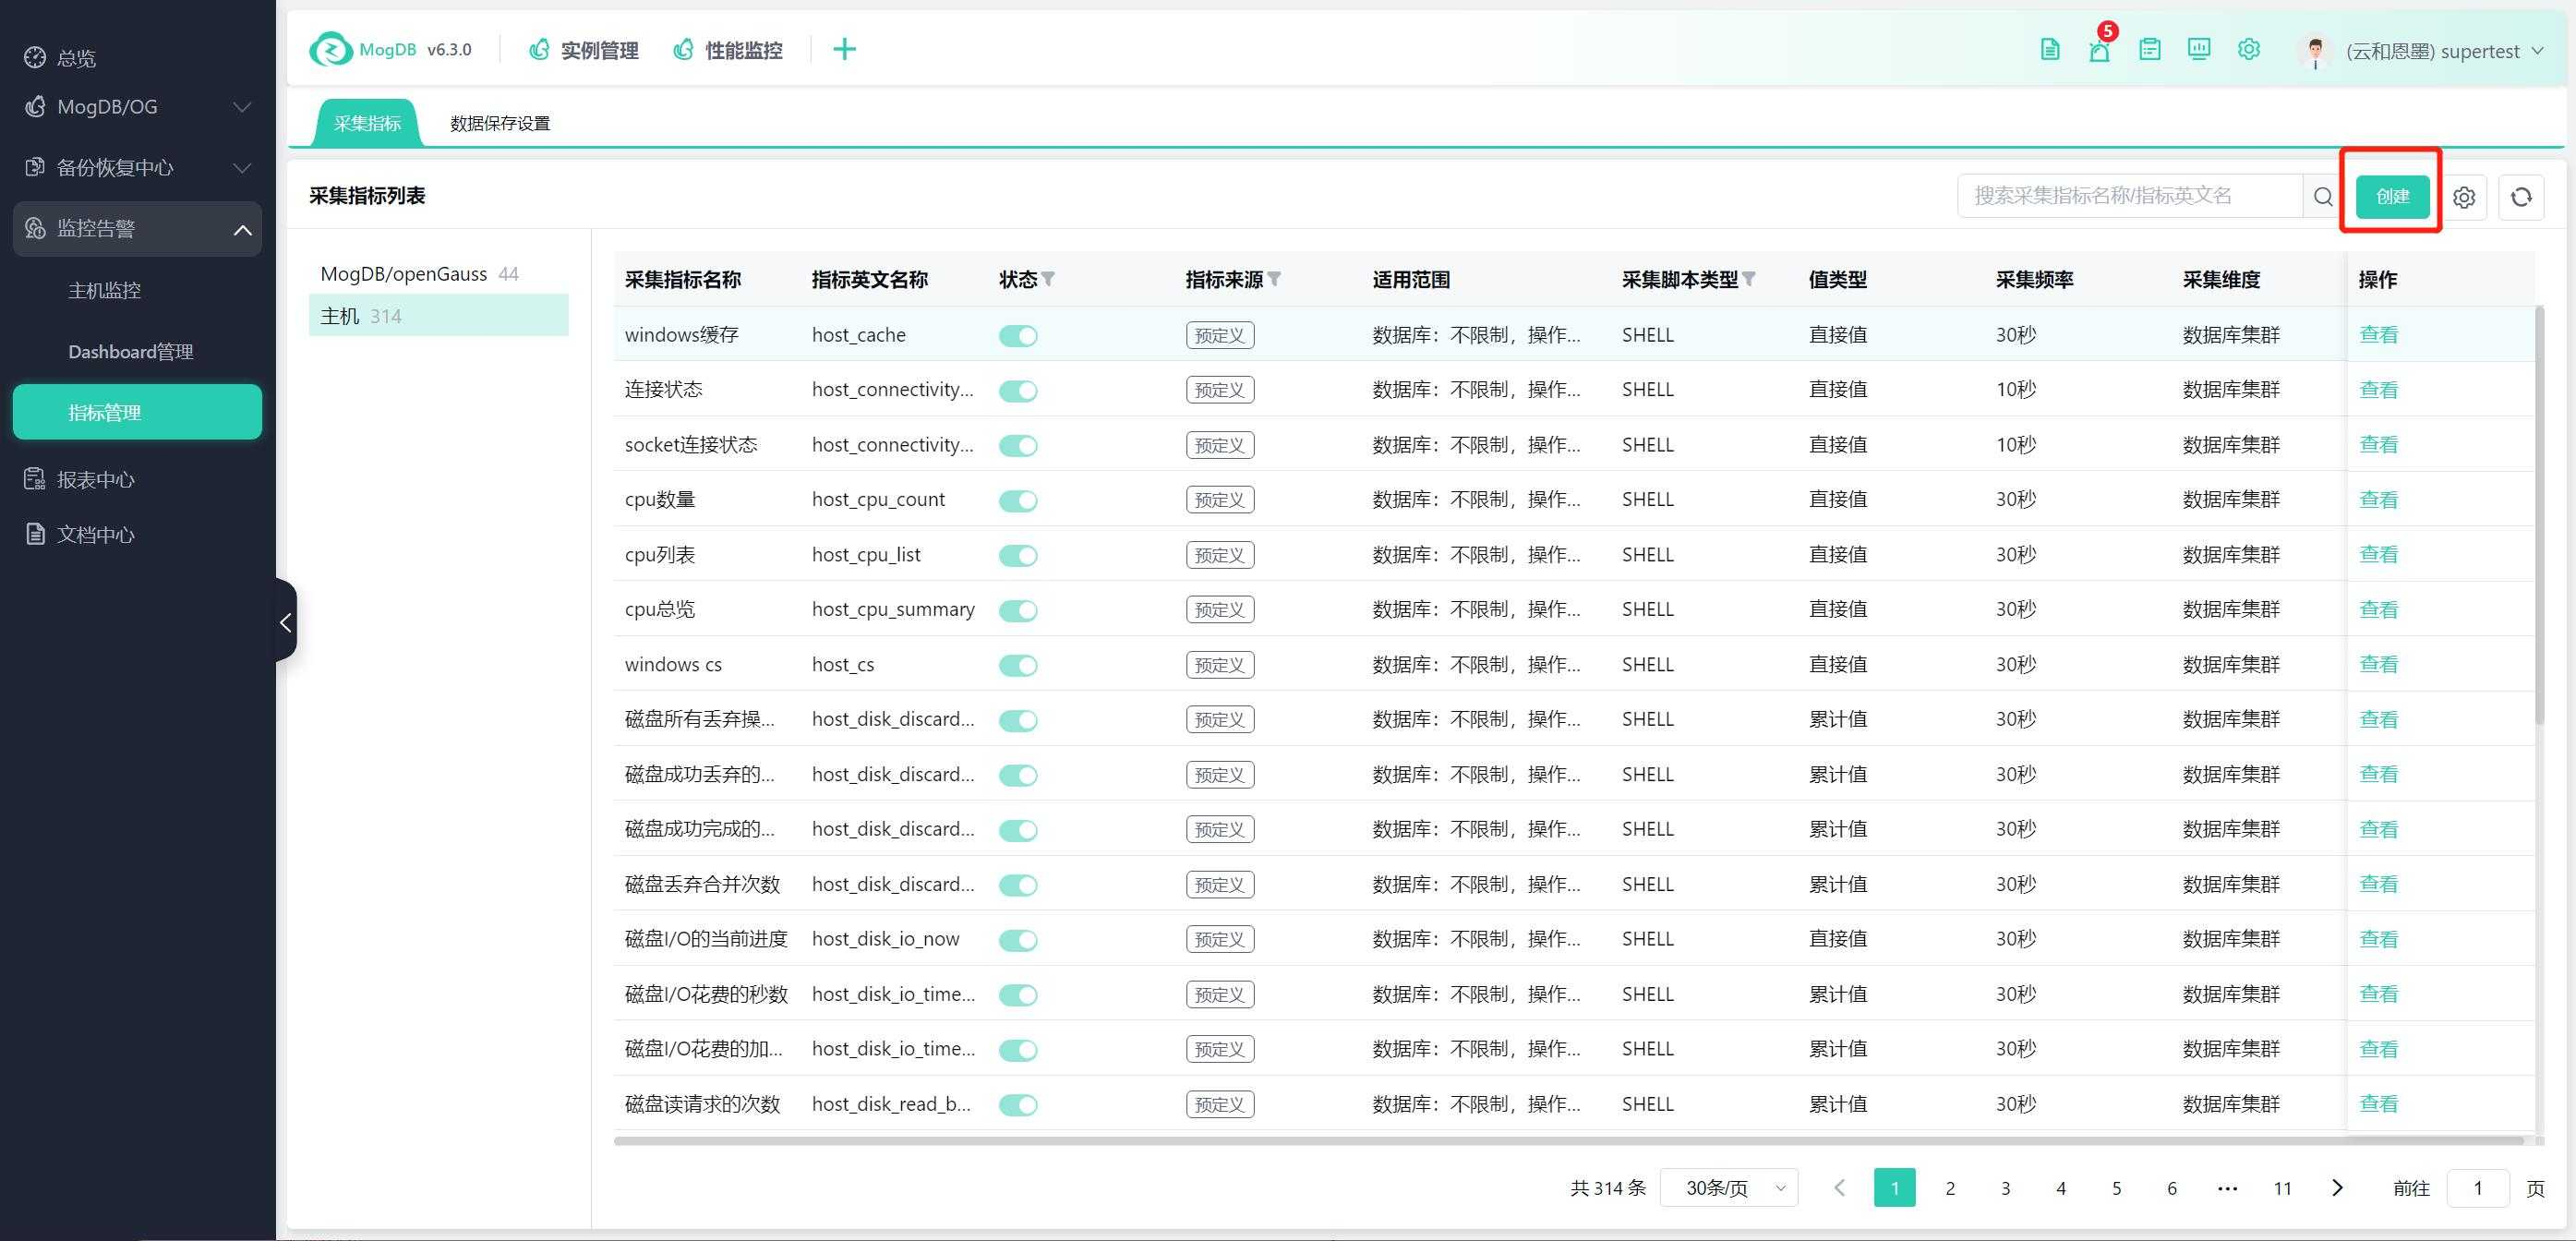
Create Custom Metrics
If the platform's predefined collection items do not meet your needs, you can click the [Create] button to create a new metric collection.
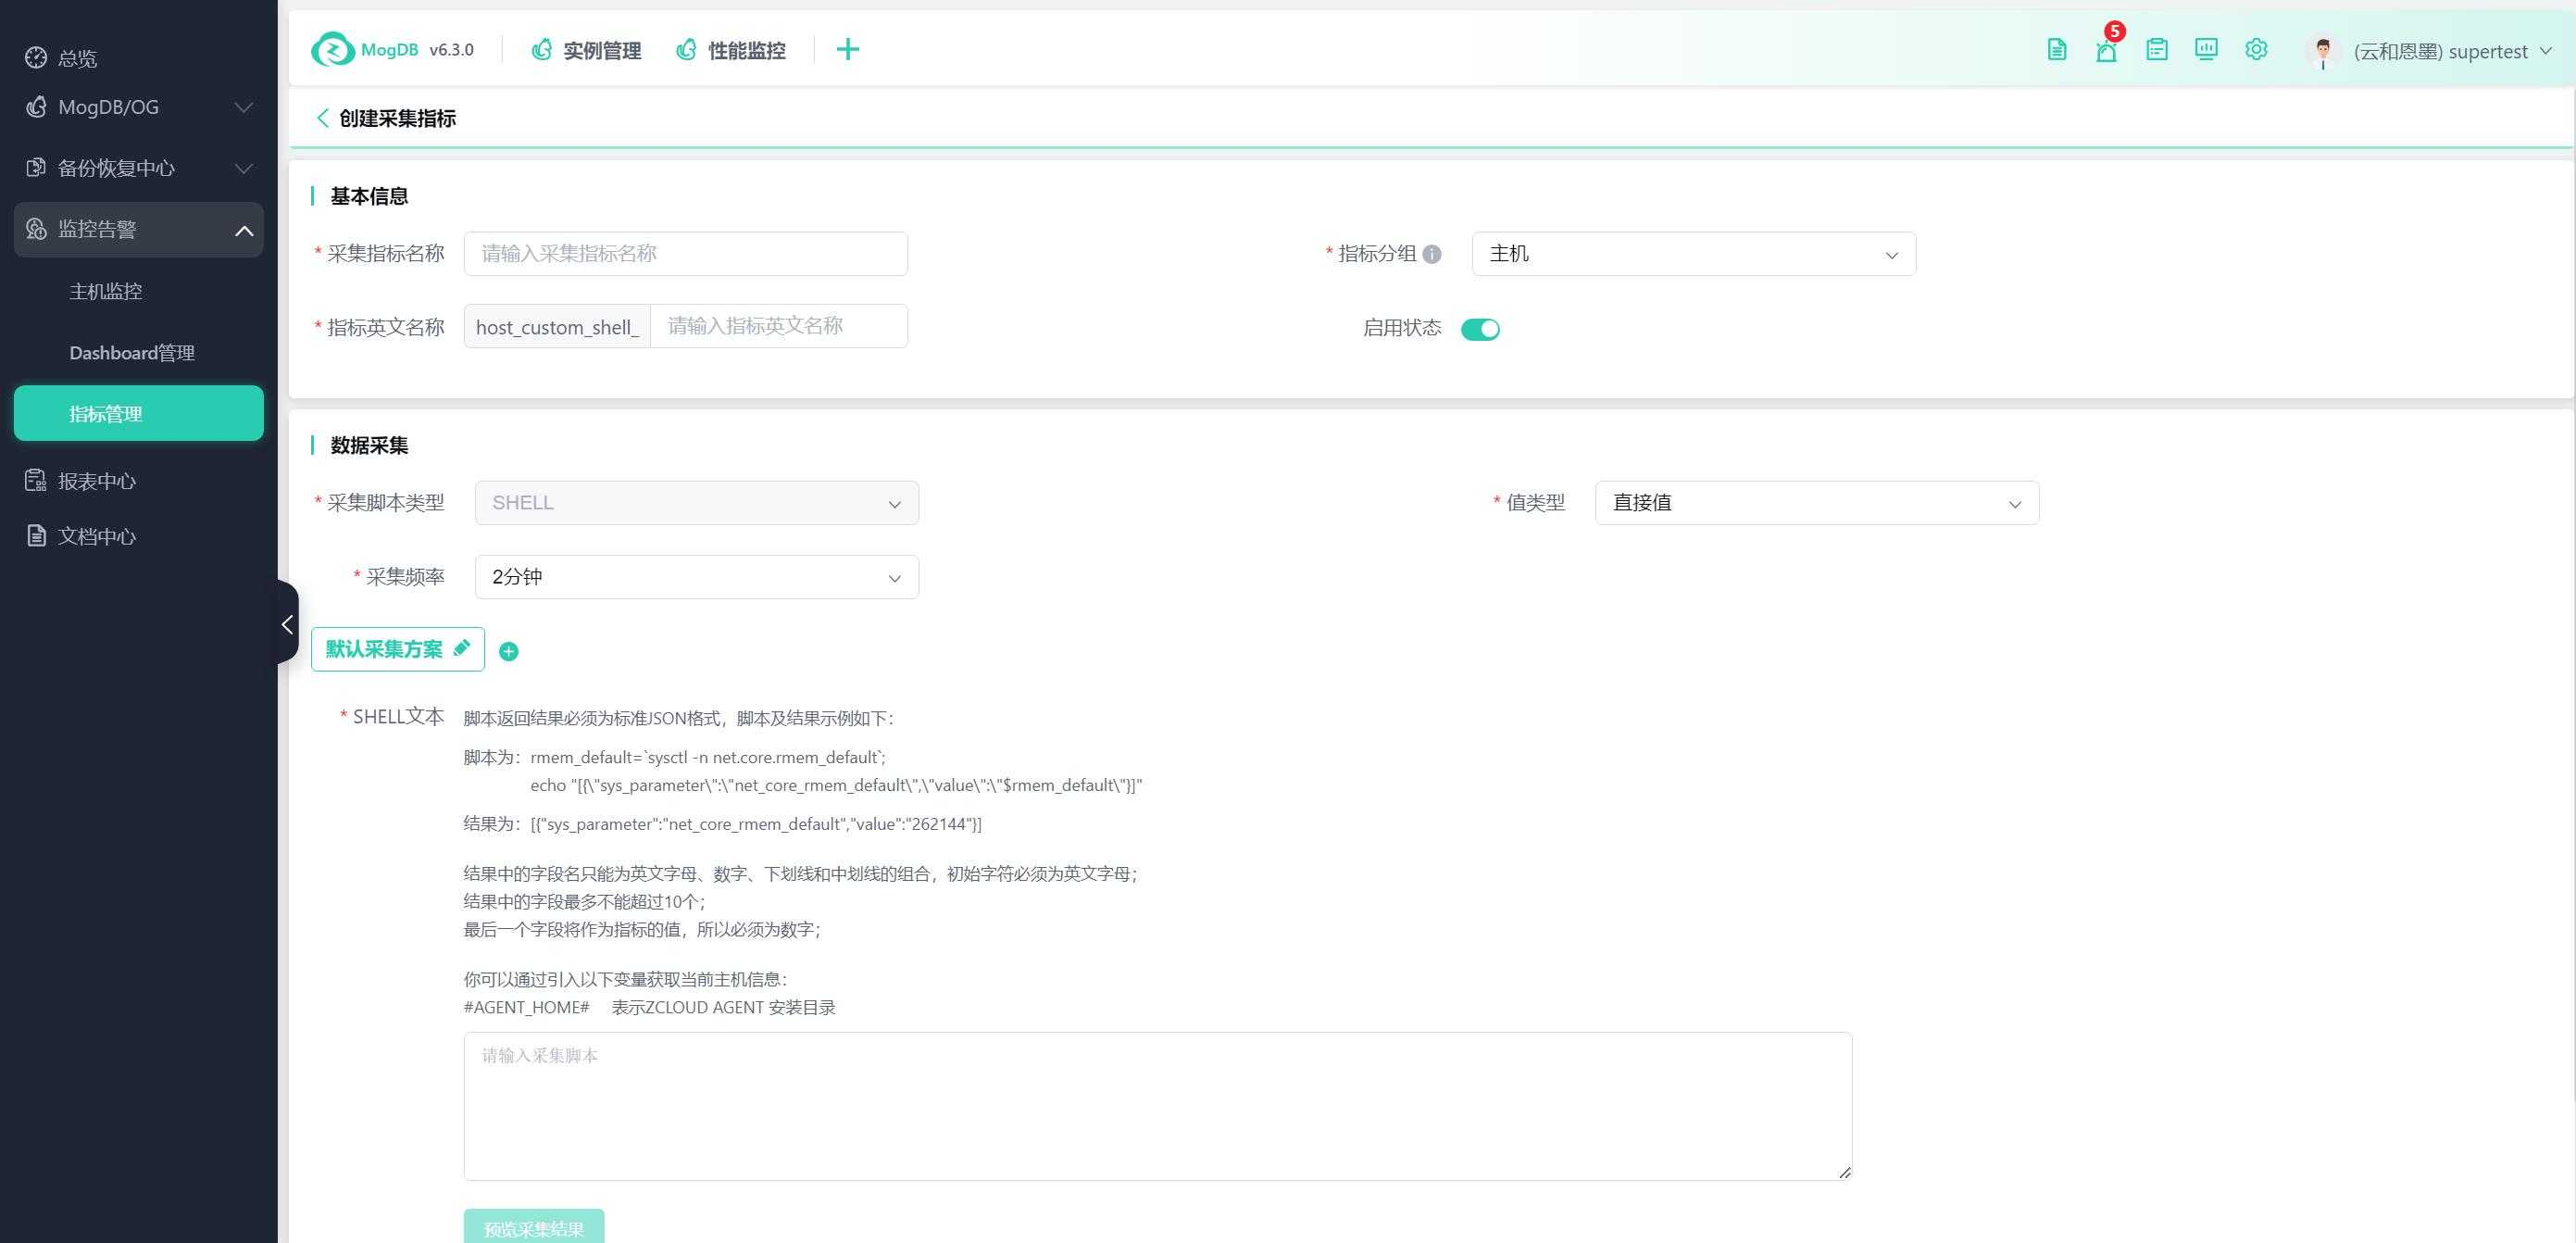
Collection Metric Name: Supports input in Chinese, the display name of the metric within the platform.
Metric English Name: The unique identifier for the metric collection, in the Prometheus collection item command rules as: database type_custom_metric English name.
Metric Grouping: Host or MogDB/openGauss.
Enable Status: Enabled means automatically activated upon creation.
Collection Script Type: Supports SQL or SHELL.
Value Type:
- Direct value, Prometheus gauges, an increment-decrement metric type, monitoring and alerting calculate the directly obtained value.
- Cumulative value, Prometheus counters, an increment-only metric type, unless reset, monitoring and alerting calculate the incremental difference.
Collection Frequency: The interval time between two collections, default is 2 minutes.
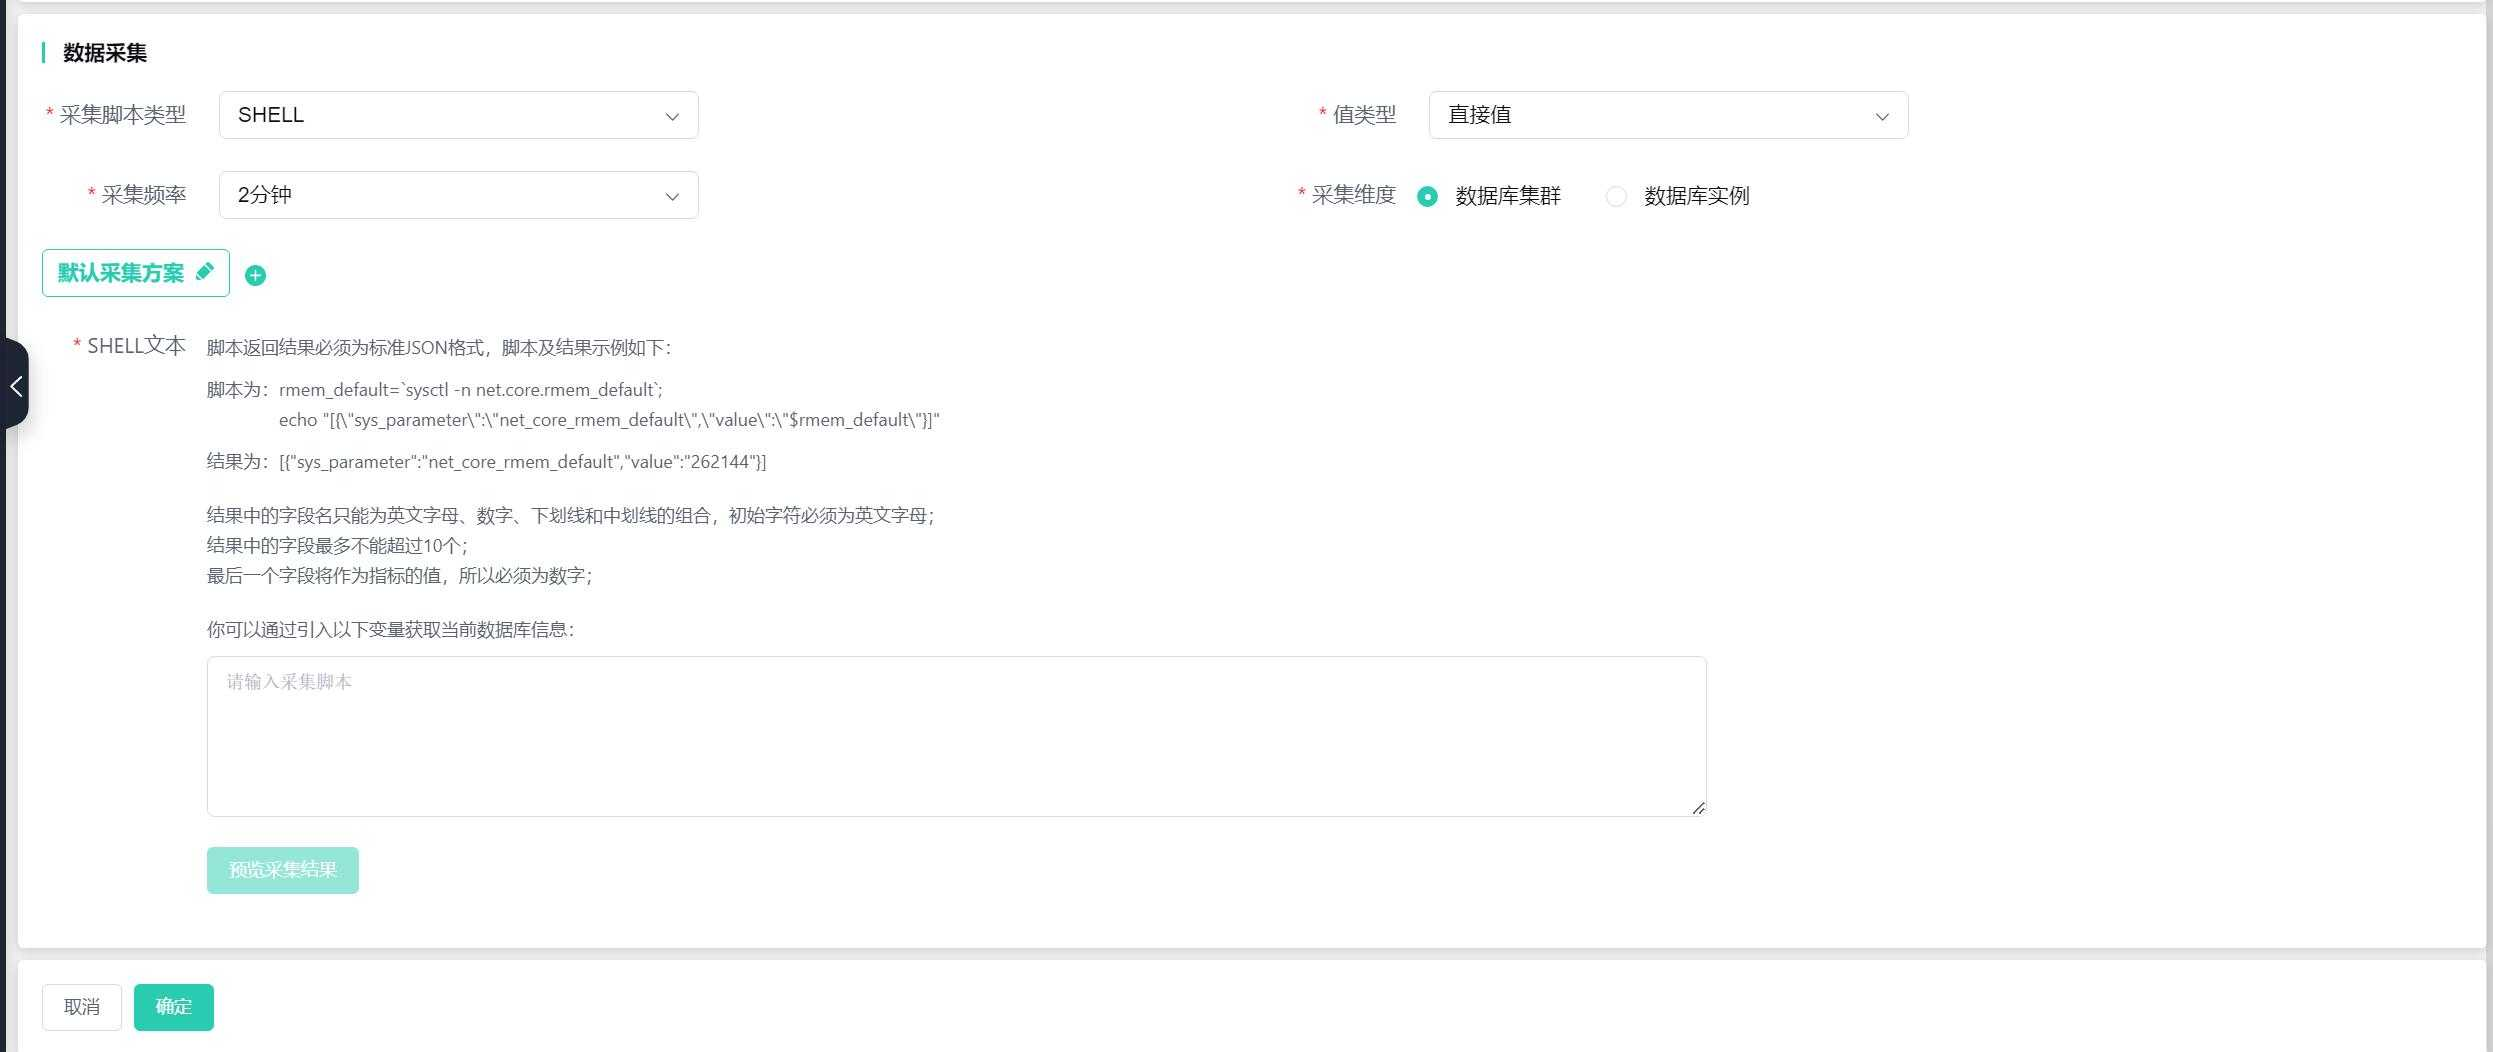
Collection Dimension:
- Database Cluster: Collect by database, one database is collected once.
- Database Instance: Collect by instance, all instances will be collected.
Collection Scheme: Supports different collection scripts for different database versions or specified databases. The collection will automatically select the matching collection scheme for data collection. Schemes support adding, deleting, and modifying.
SQL Statement:
- The SQL statement for collection must be a select statement.
- The text must not exceed 10K.
- Fields must start with an English letter and can include numbers and underscores, dashes, to be consistent with Prometheus label tags.
- The last field must be numeric because the collected data will be summarized and displayed by Prometheus, and the last field serves as the Prometheus metric value, so it must be numeric.
- SQL statements can query up to 10 fields.
- The collection return value should not be too large to avoid affecting performance.
- Do not end the SQL statement with a semicolon.
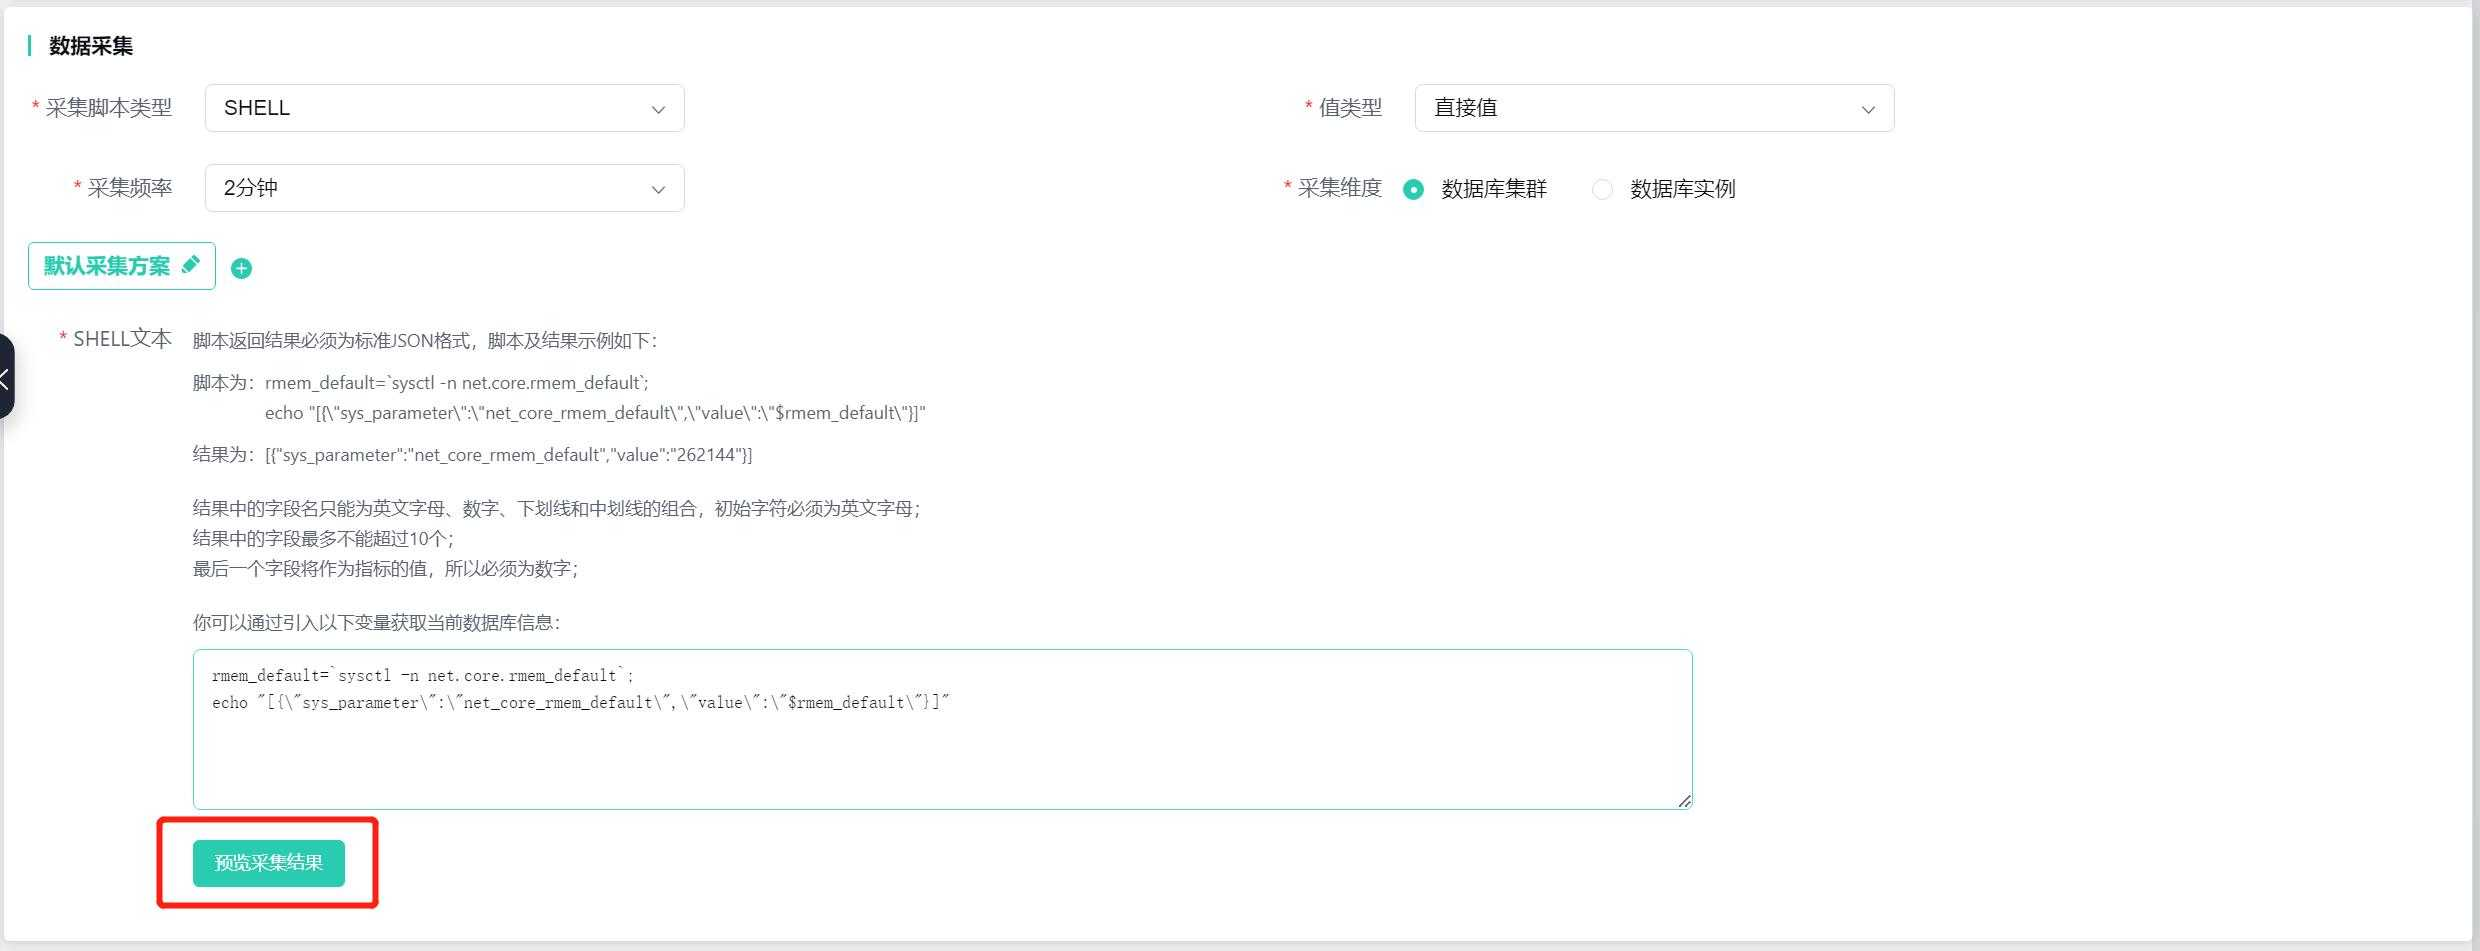
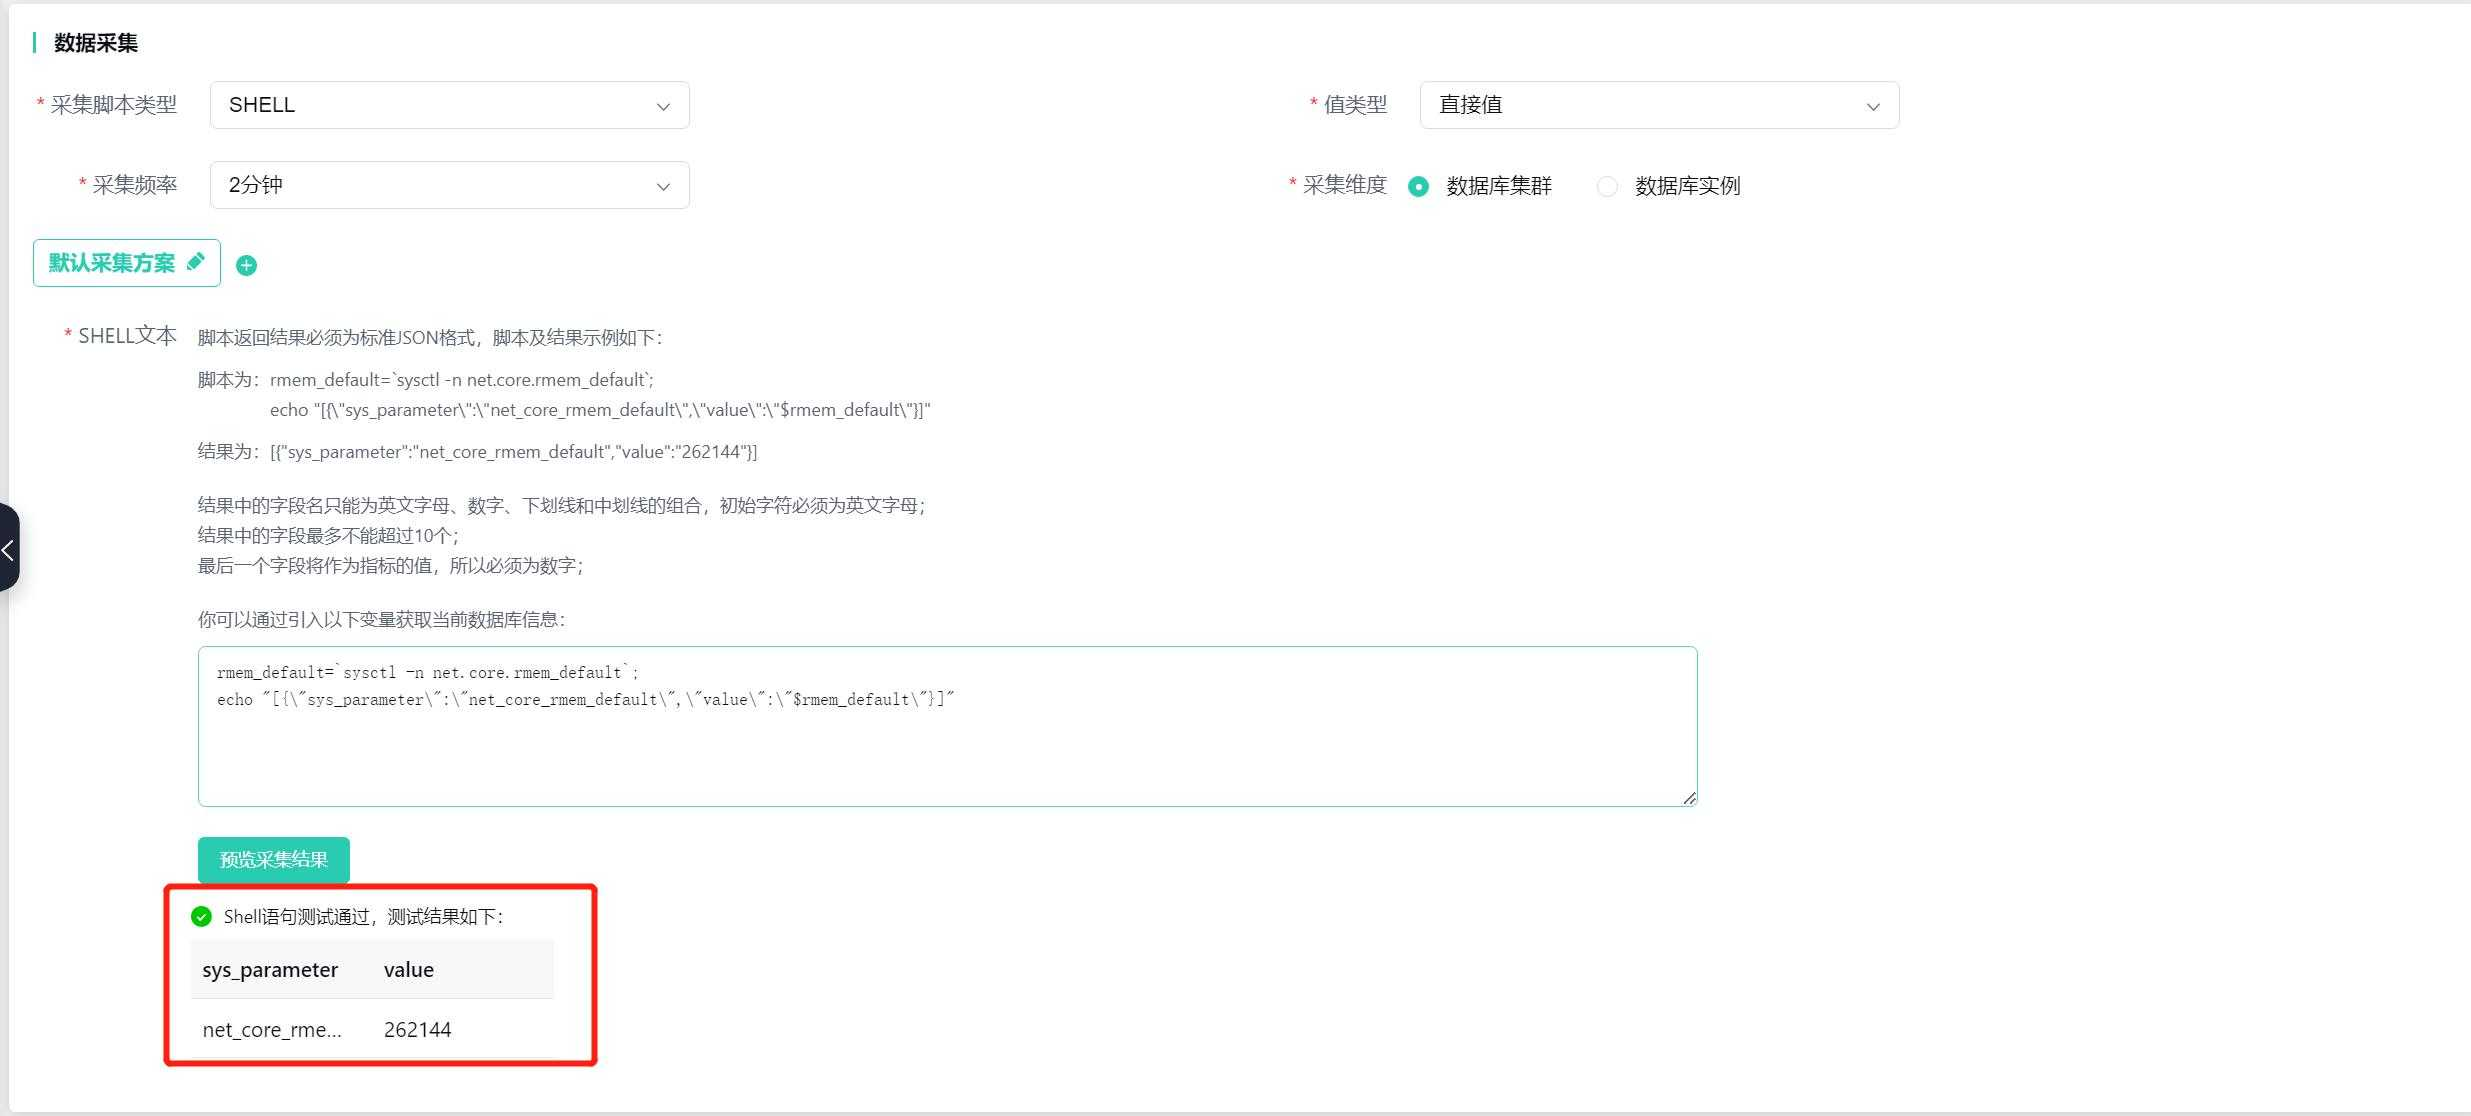
SHELL Statement:
- The script return result must be in standard JSON format.
- The field names in the result can only be a combination of English letters, numbers, underscores, and dashes, starting with an English letter.
- The result can have no more than 10 fields.
- The last field will serve as the metric value, so it must be numeric.
- You can introduce variables to obtain current database information, please refer to the page prompts for variables of different database types.
After inputting the statement, click "Test SQL Statement" to test if the collection SQL can run normally.
You need to select a test database object in the pop-up window:
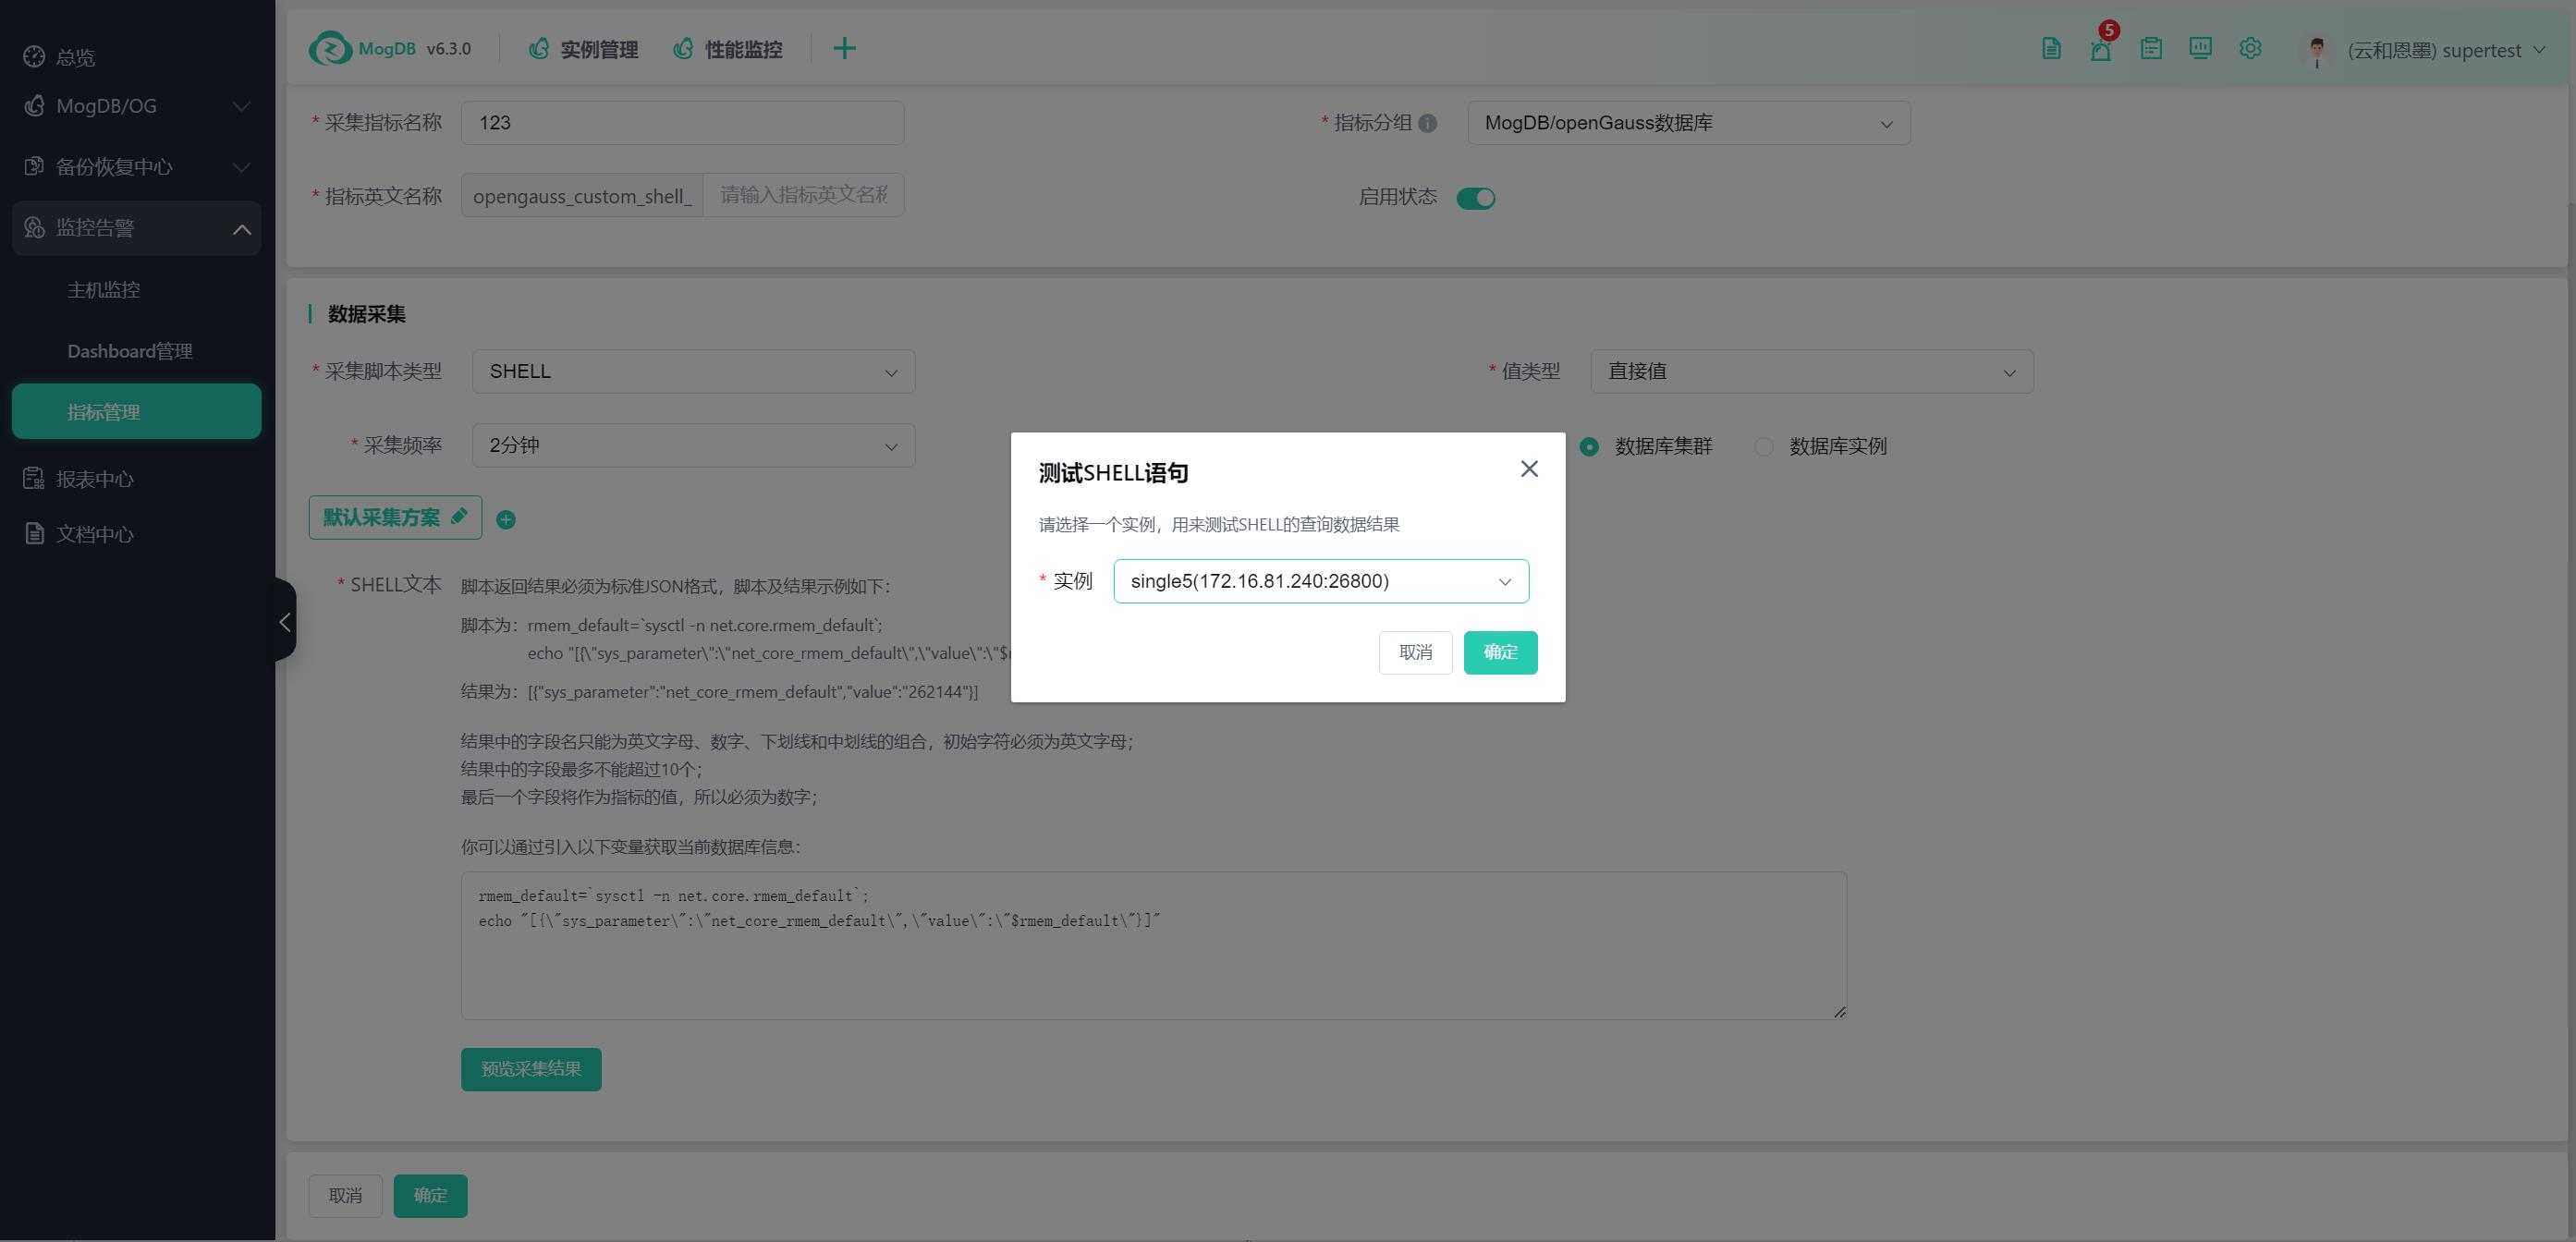
After a successful test, the result will be displayed:
All schemes must be tested and passed before you can click [Confirm] to save.
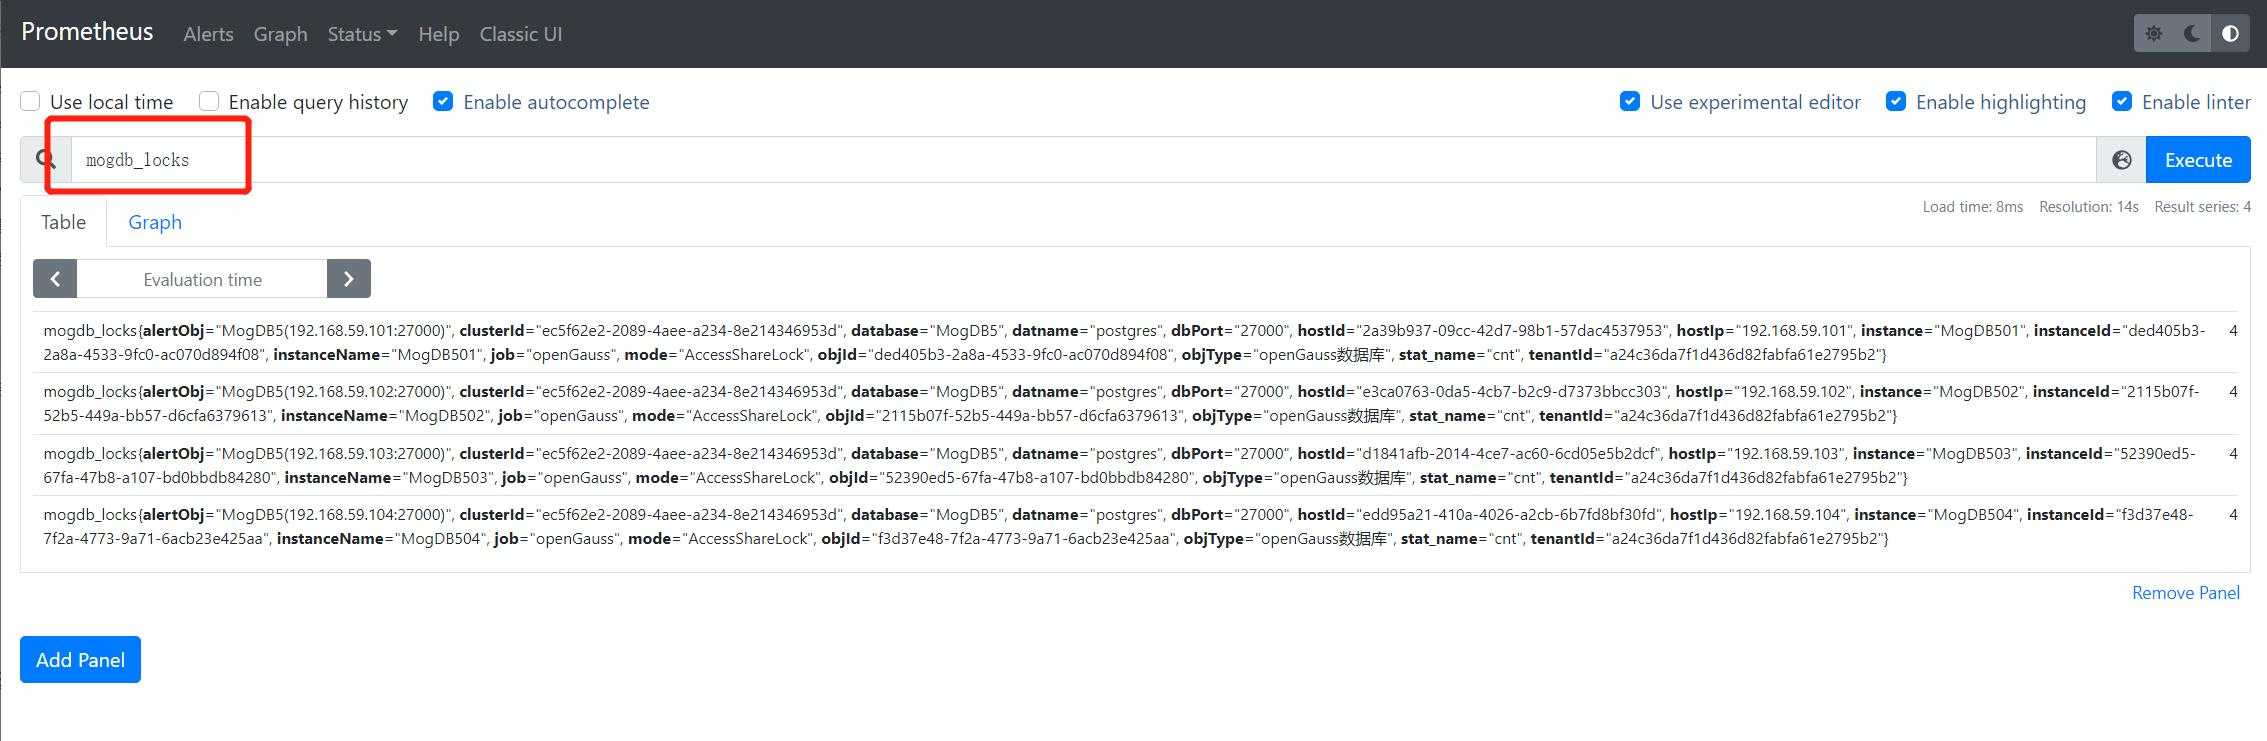
Wait for a while (about 2-3 minutes) and then log in to the platform's Prometheus management page to check if the collection is successful. The address is: http://platform_IP_address:8093. Enter the English name of the custom SQL metric collection, and it will automatically associate and display. Click "Execute" to run the query (there may be no data returned within the collection interval).
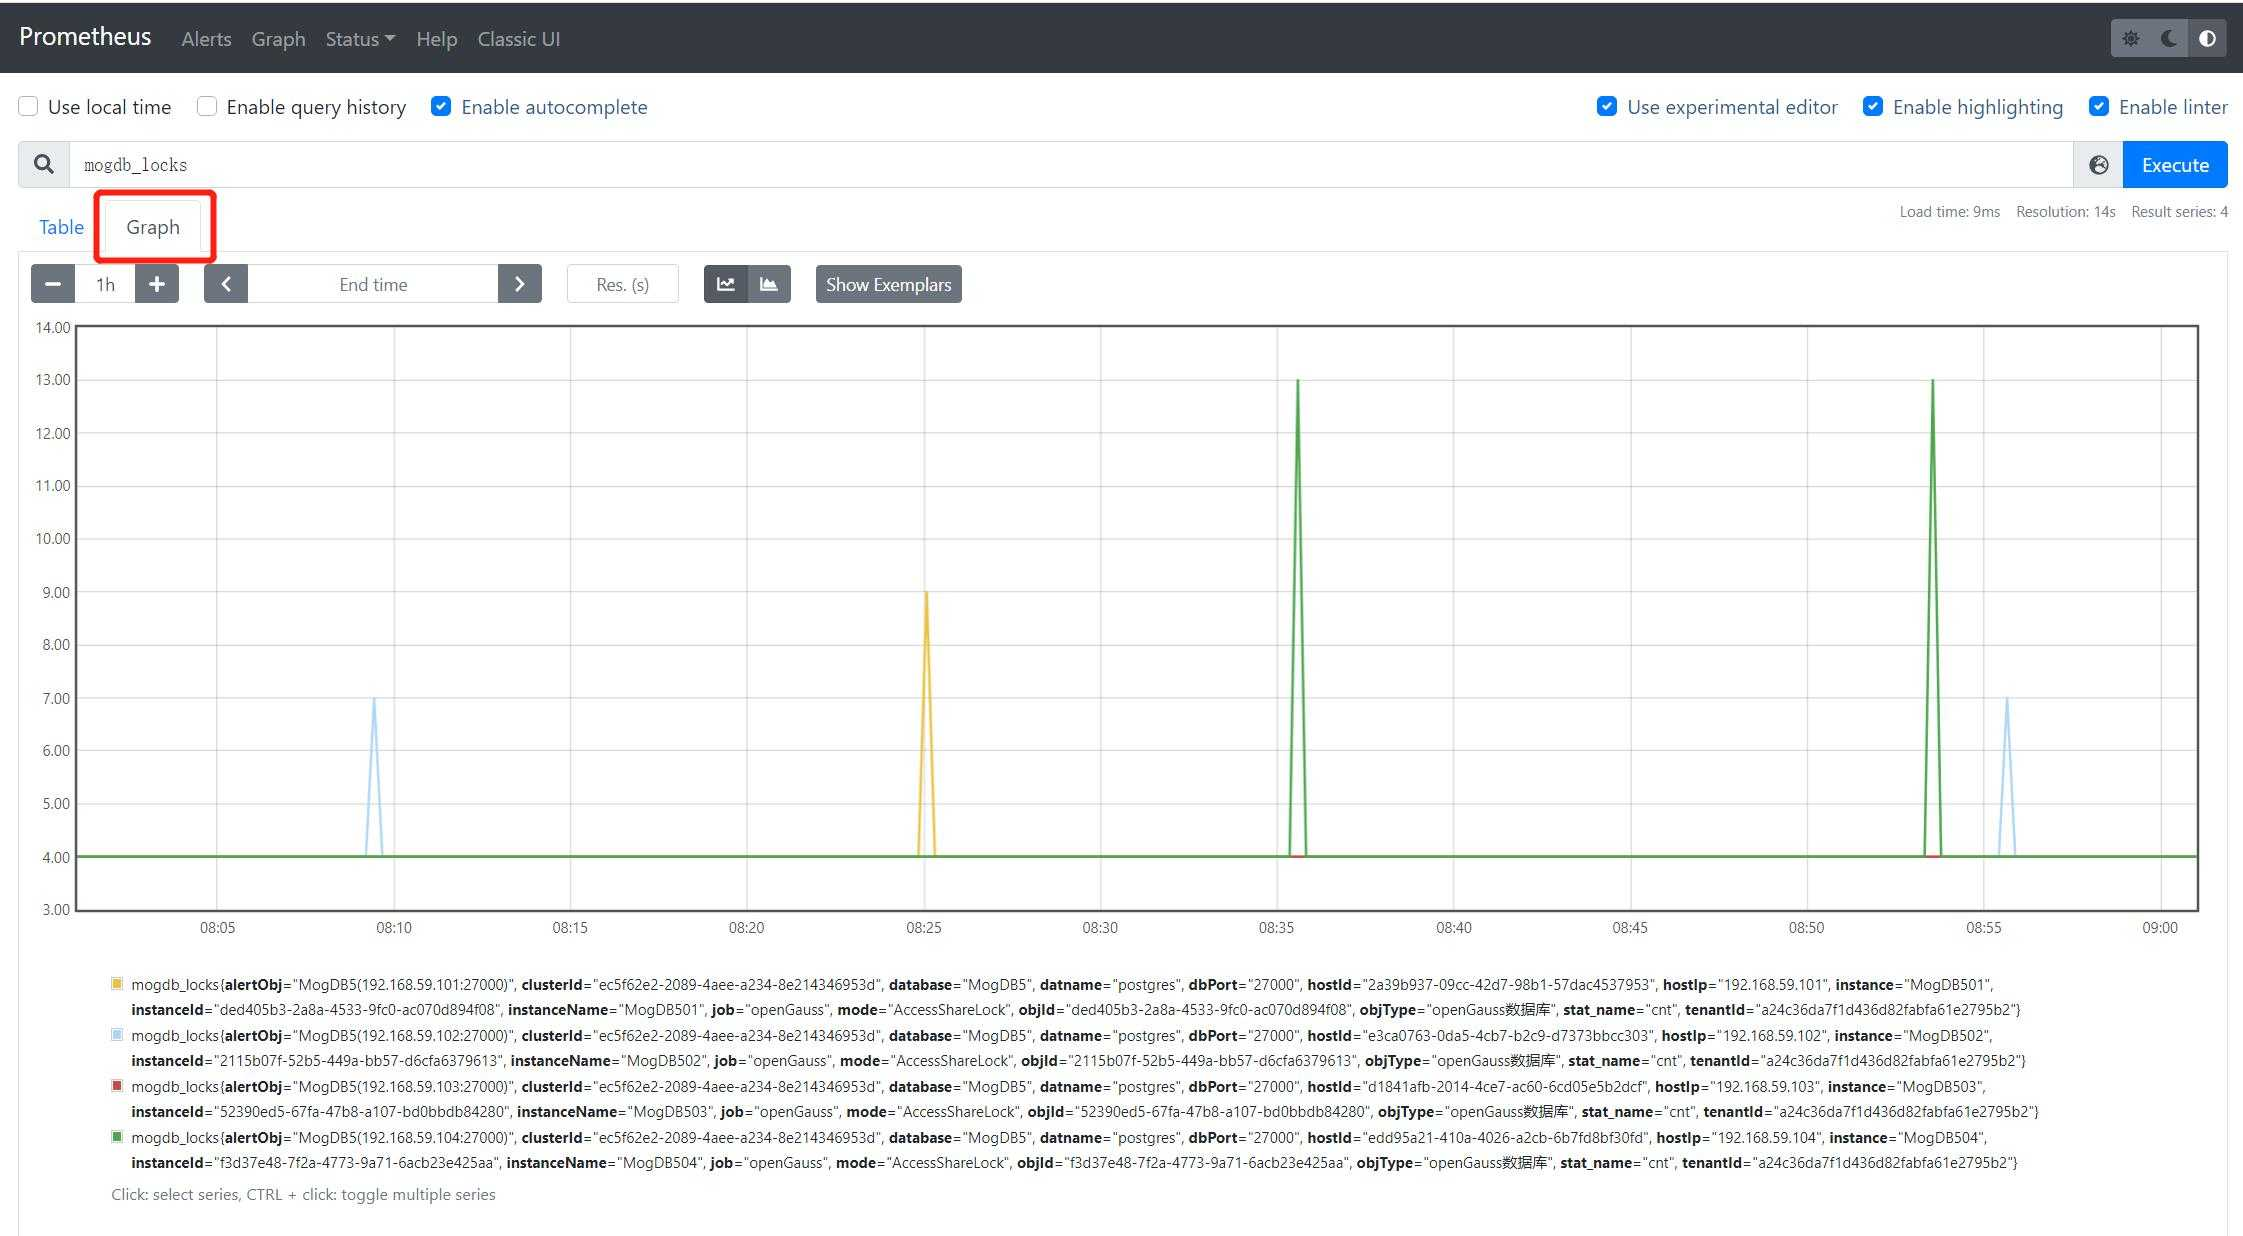
Click "Graph" to view historical collection values:
Data Retention Settings
You can set the retention period for the platform's collection metrics, which defaults to 30 days.