- About
- Basic Features
- Introduction
- Platform Tenant Management
- Platform User Management
- TOTP Certification
- Basic Data Definition
- Media Management
- Command Management
- Mail Server Configuration
- Job Center
- Platform Host Resource Pool
- Platform Database Pool
- Platform Proxy Nodes Management
- Platform Components Management
- Additional Information Management
- Operation Log
- Connection Concurrency Configuration
- Customization of Platform Styles
- Parameter Templates
- License
- Monitor Large Screen
- Overview Display
- Tenant User Management
- Tenant Host Resource Pool
- Tenant Proxy Nodes Management
- Menu Management
- Report Center
- MogDB/openGauss
- Backup Recovery Center
- Monitoring
- Alert Center
- Inspect Center
Session Management
Function Entrance
MogDB/openGauss --> Performance Monitoring --> Instance --> Session Management
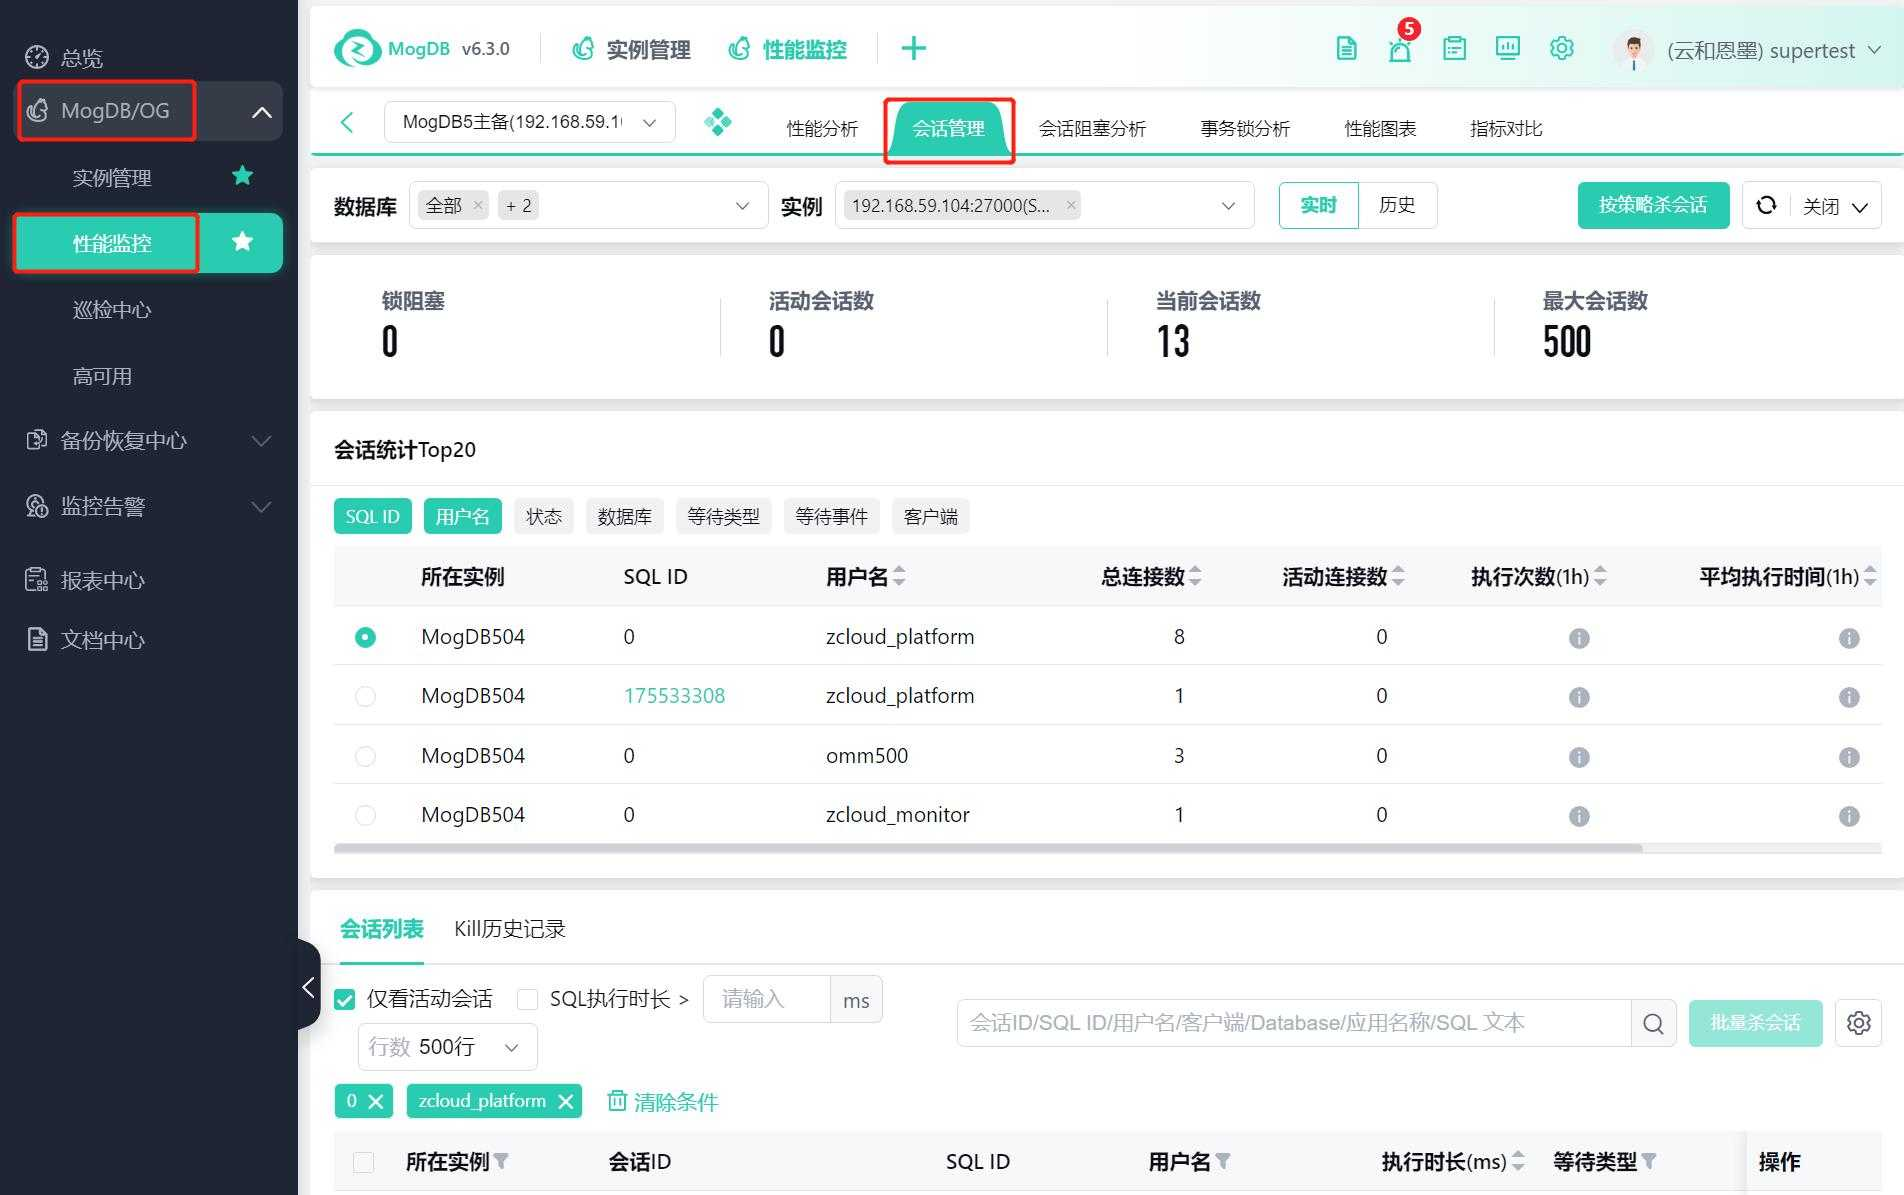
Function Description
Session Management: Manage active sessions and view historical sessions.
Operating Instructions
Real-time Session Management
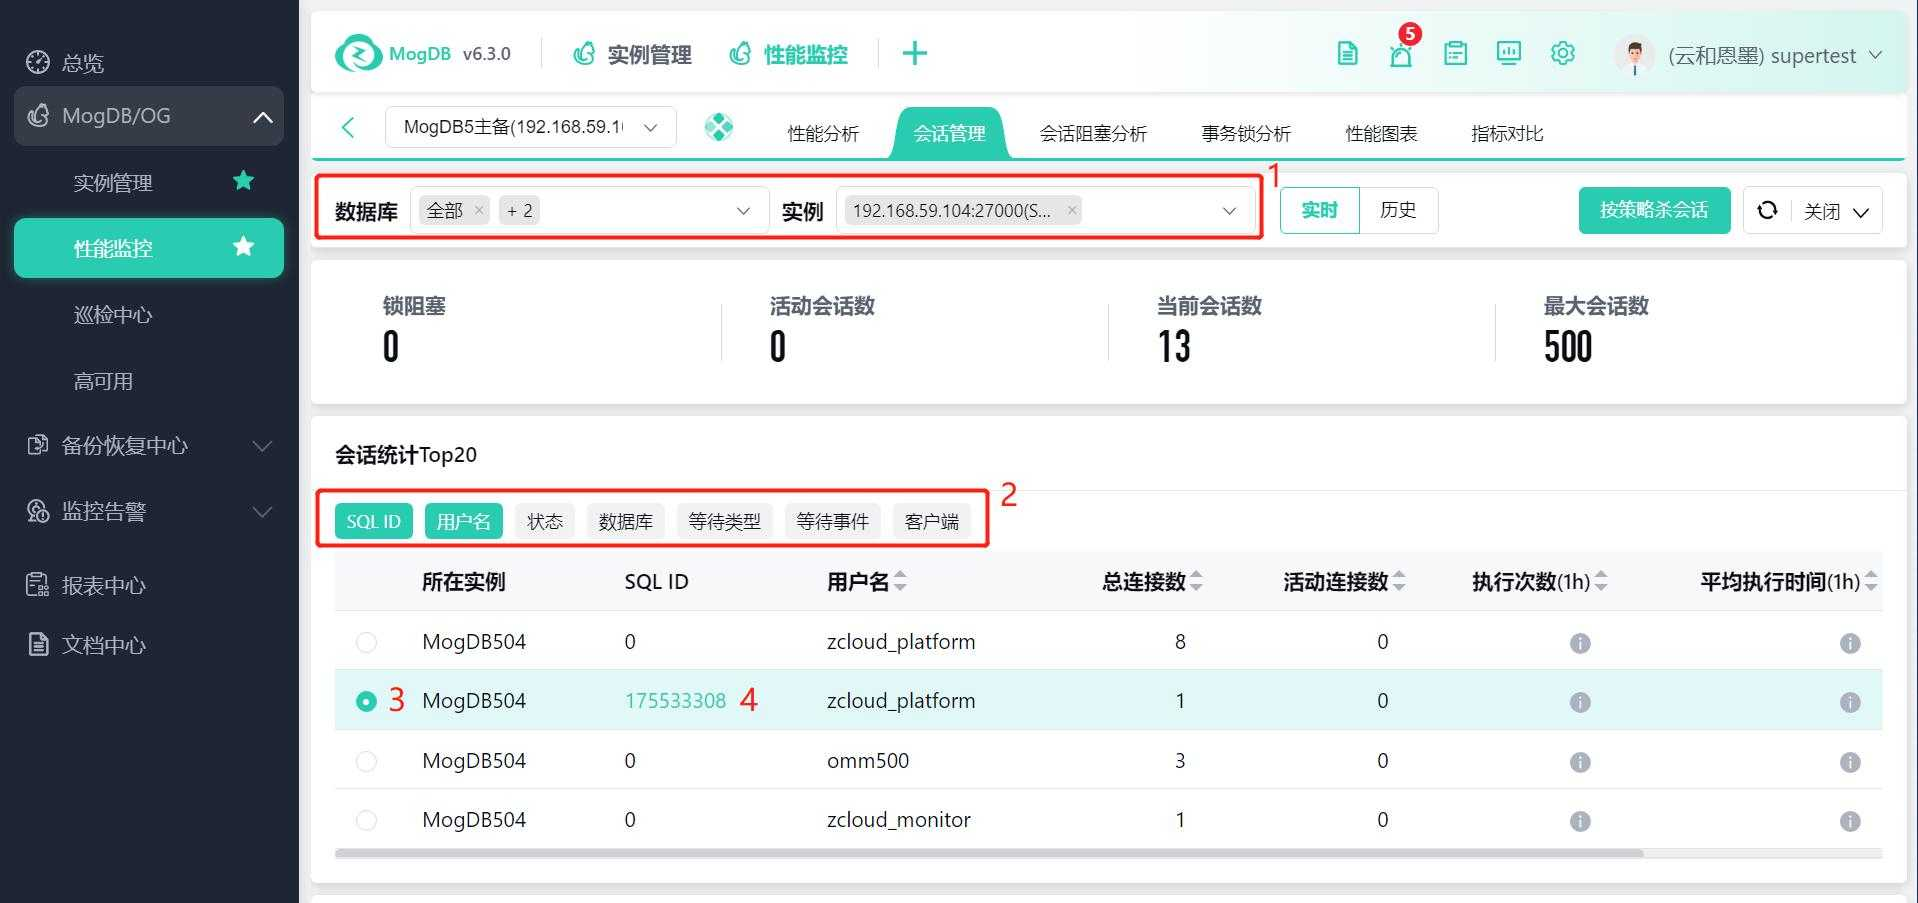
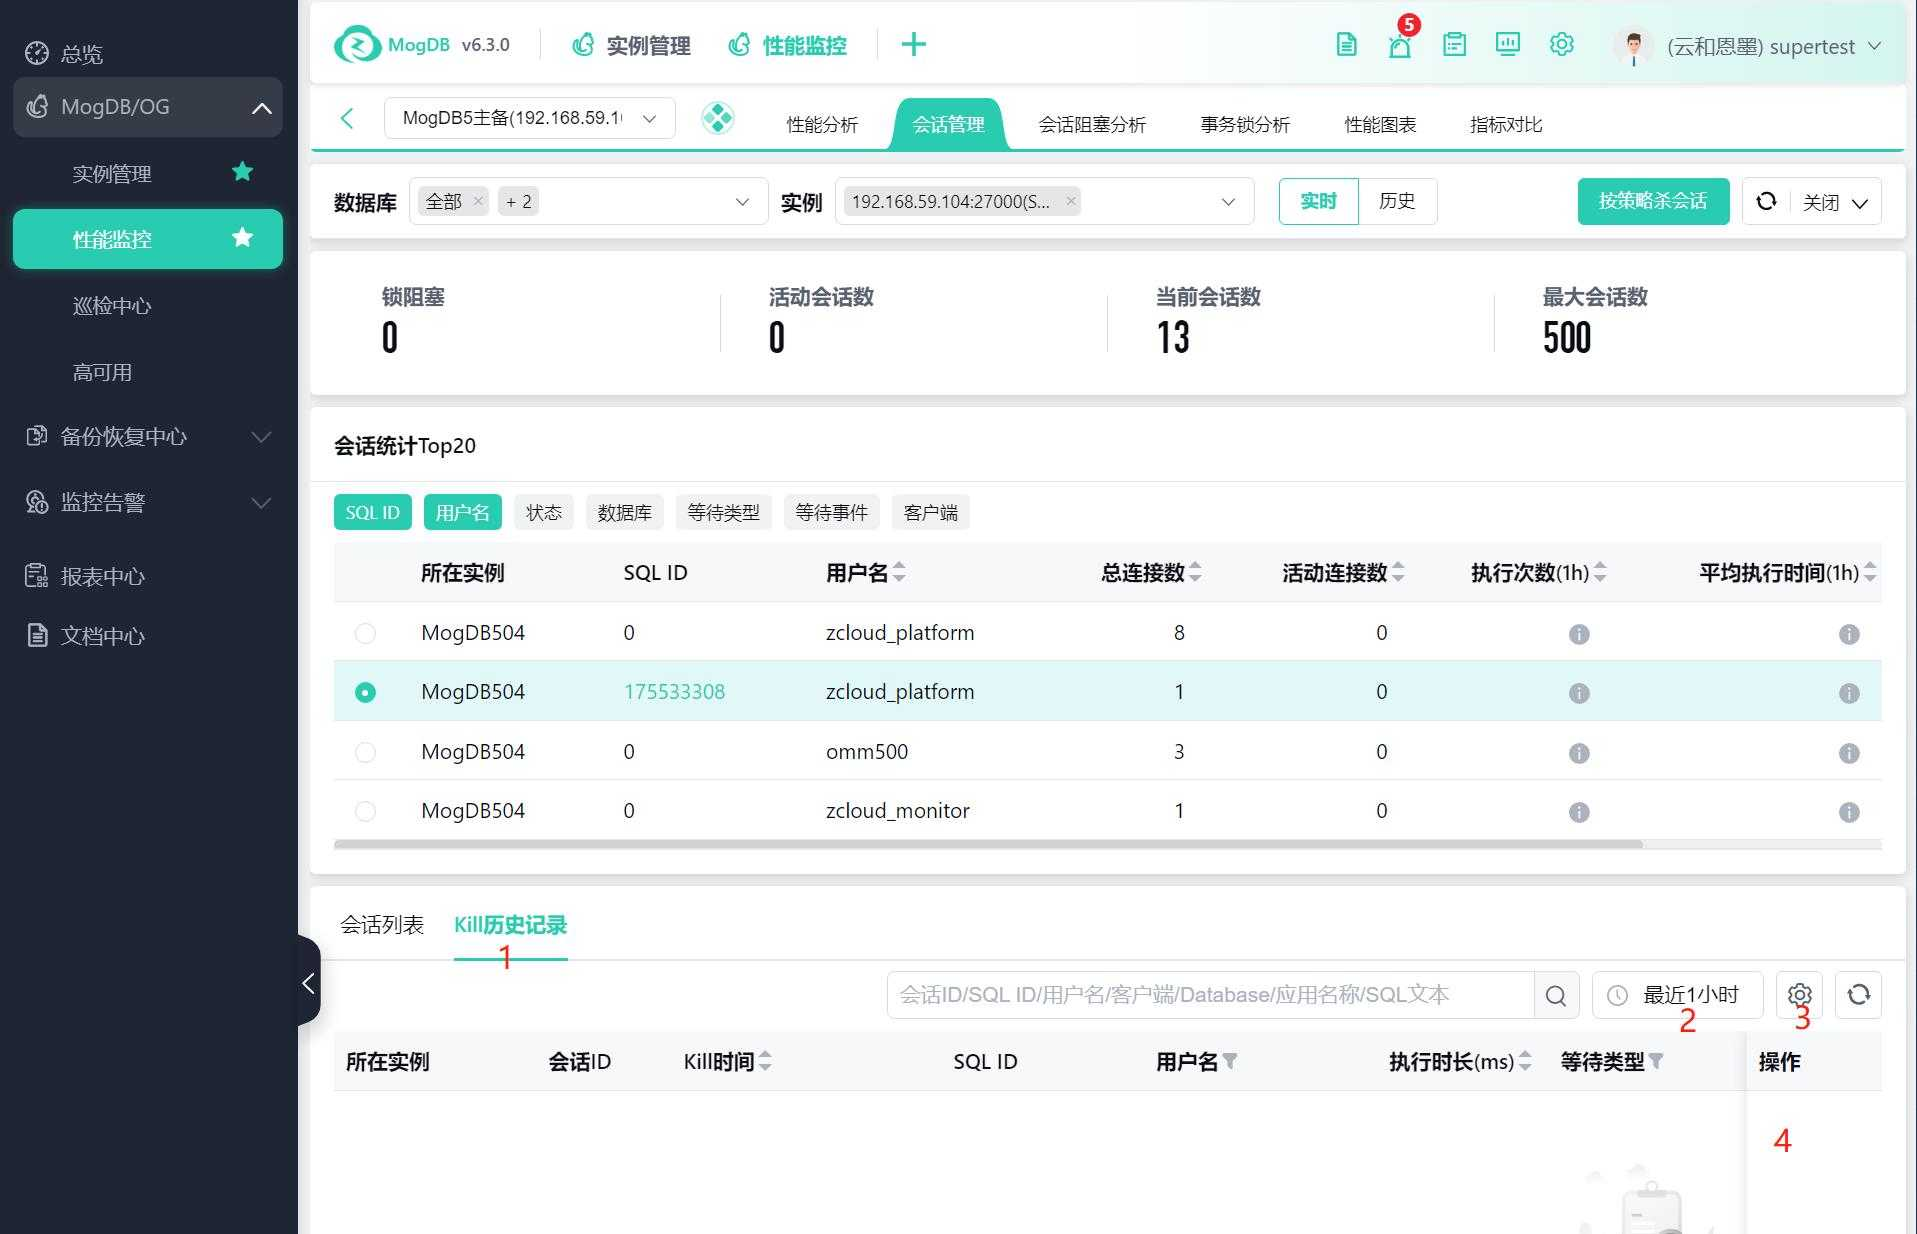
Session Statistics TOP20 List
Click the instance selection box ① to select instances, support multi-select, and list the session statistics TOP20 based on the selected instances.
Click any field column tag ② to add the corresponding field information to the session statistics TOP20 list, displaying the data information of that field's statistics.
The session TOP20 list supports single-select session ③. After selecting a session, the selected field tags ② will be used to filter the session list below.
Click the SQL ID ④ to jump to the corresponding SQL details page. Hover the mouse over the SQL ID ④ to display the SQL ID information popup.
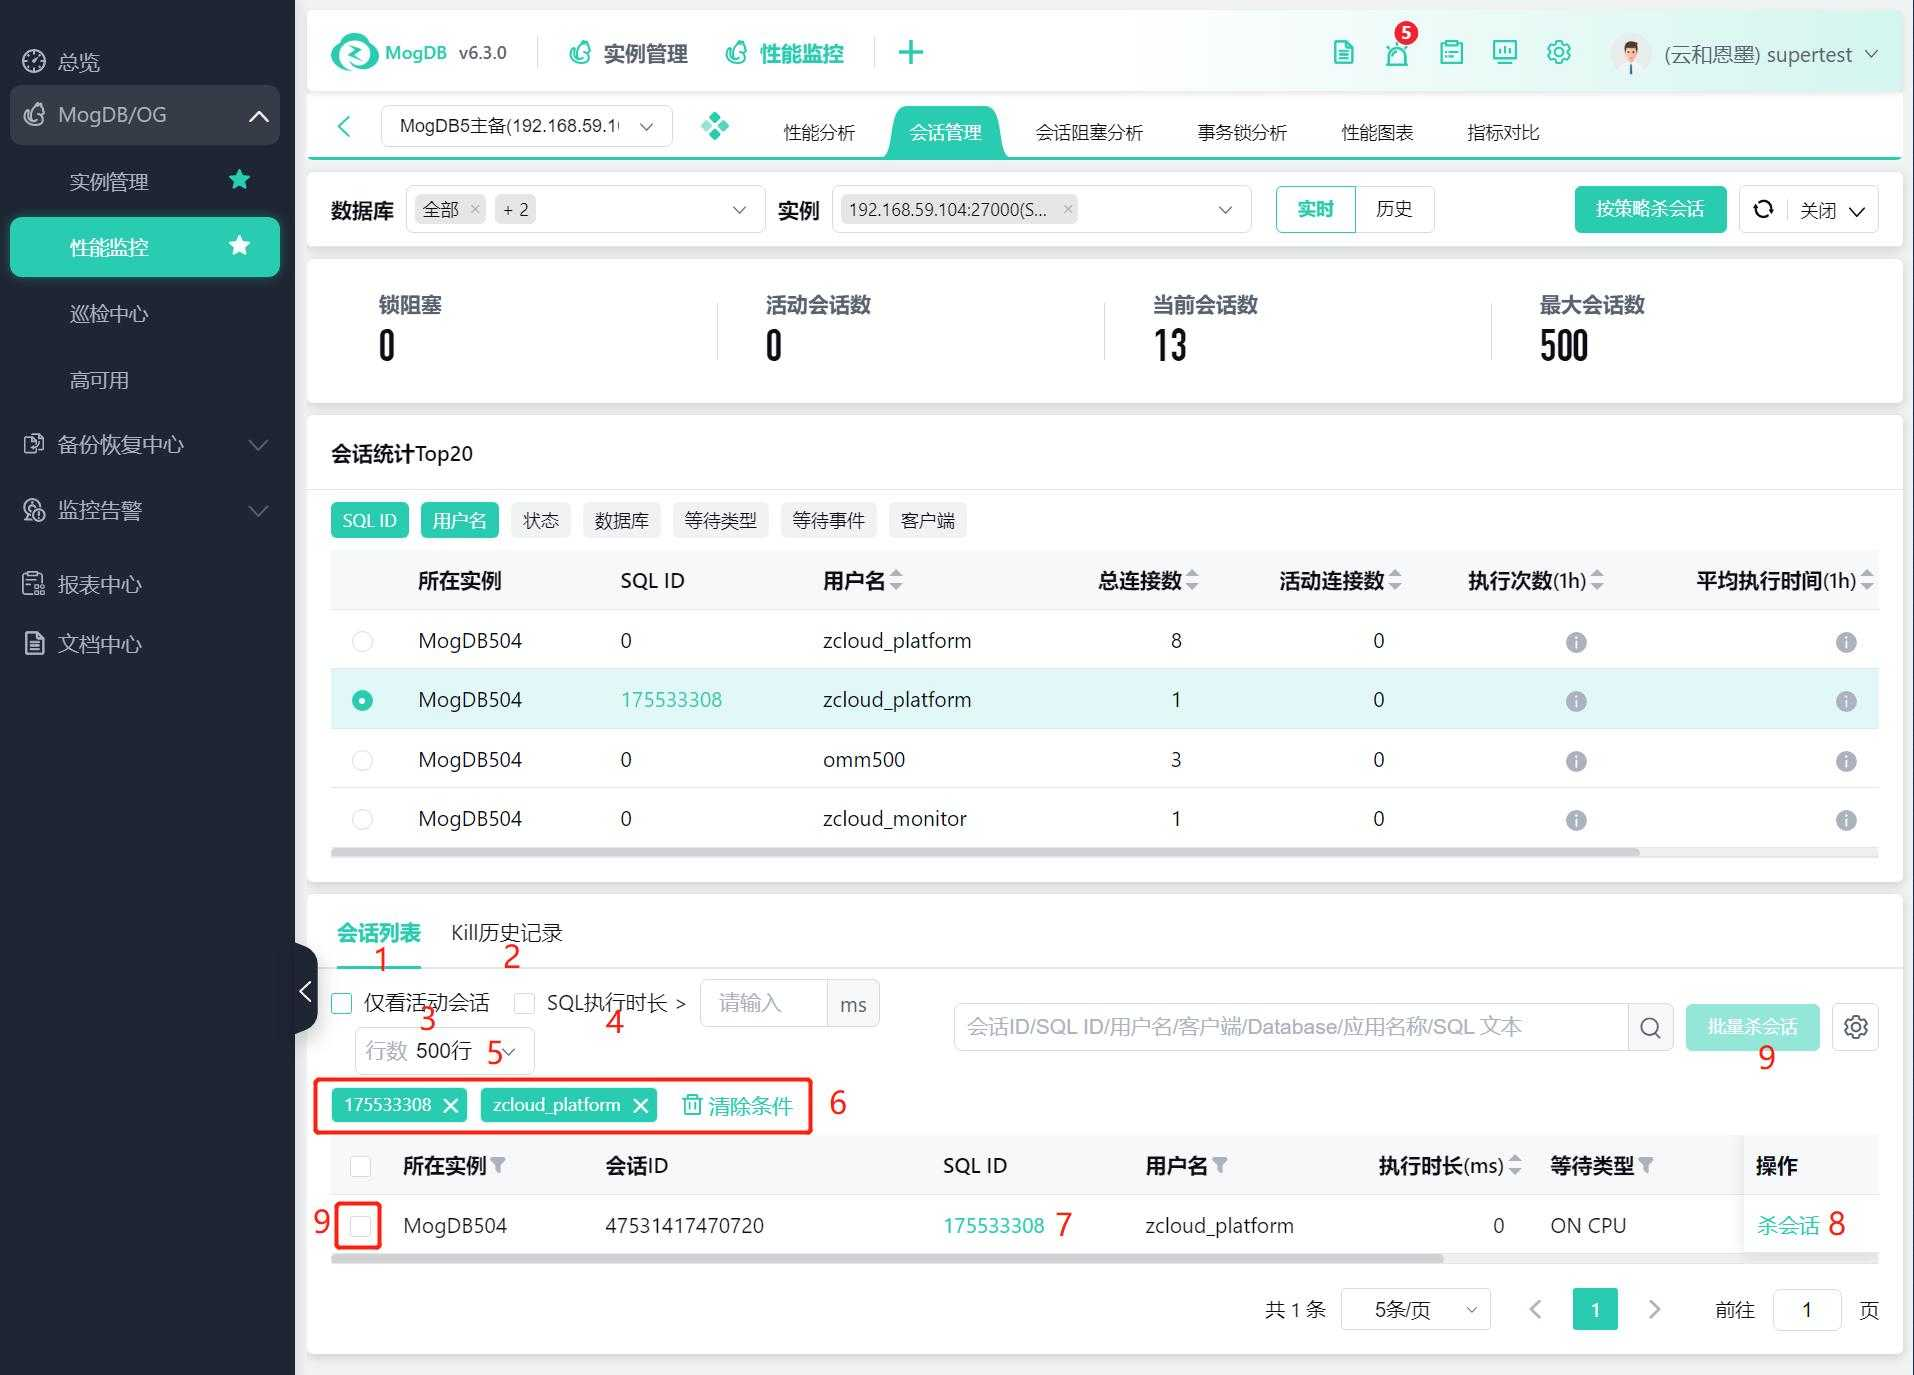
Session List
① The session list displays all session information and can be filtered by the number of lines displayed according to the drop-down control ⑤.
② Kill History Record ② displays the history of sessions that have been killed.
③ Check the box to view only active sessions, and the session list will only display active sessions.
④ Check the execution duration box ④ and enter a value in the input box. The list will only display session information with an execution duration less than the entered value.
⑤ You can choose the default number of lines displayed in the session list through the drop-down box ⑤.
⑥ Filter Tag: This Tag field value is brought in through the selected column field information in the session statistics TOP20 list. As shown in the figure above ②, if you select 【SQL ID】and 【Username】, these two field values will be used to filter the session list.
⑦ SQLID Hyperlink ⑦: Click the button to jump to the SQL details page. Hover the mouse over the button to display the SQLID information popup.
⑧ Kill Session ⑧: Click 【Kill Session】to display the kill session confirmation popup. Click 【Confirm】to terminate the session.
⑨ Batch Kill Sessions ⑨: After selecting multiple sessions in the list, the button becomes active. Click 【Batch Kill Sessions】to display the batch kill session confirmation popup. Click 【Confirm】to terminate the selected sessions.
Kill History Record List
① Click 【Kill History Record】to view the kill history record list.
② Click the time selector to view the kill history record based on the time range.
③ Click the 【Settings】icon button to display the custom list item settings popup, where you can set the default display of field columns in the list.
④ Operation column ④ Click the 【SQL Details】button, and a new browser tab will open and redirect to the SQL details page.
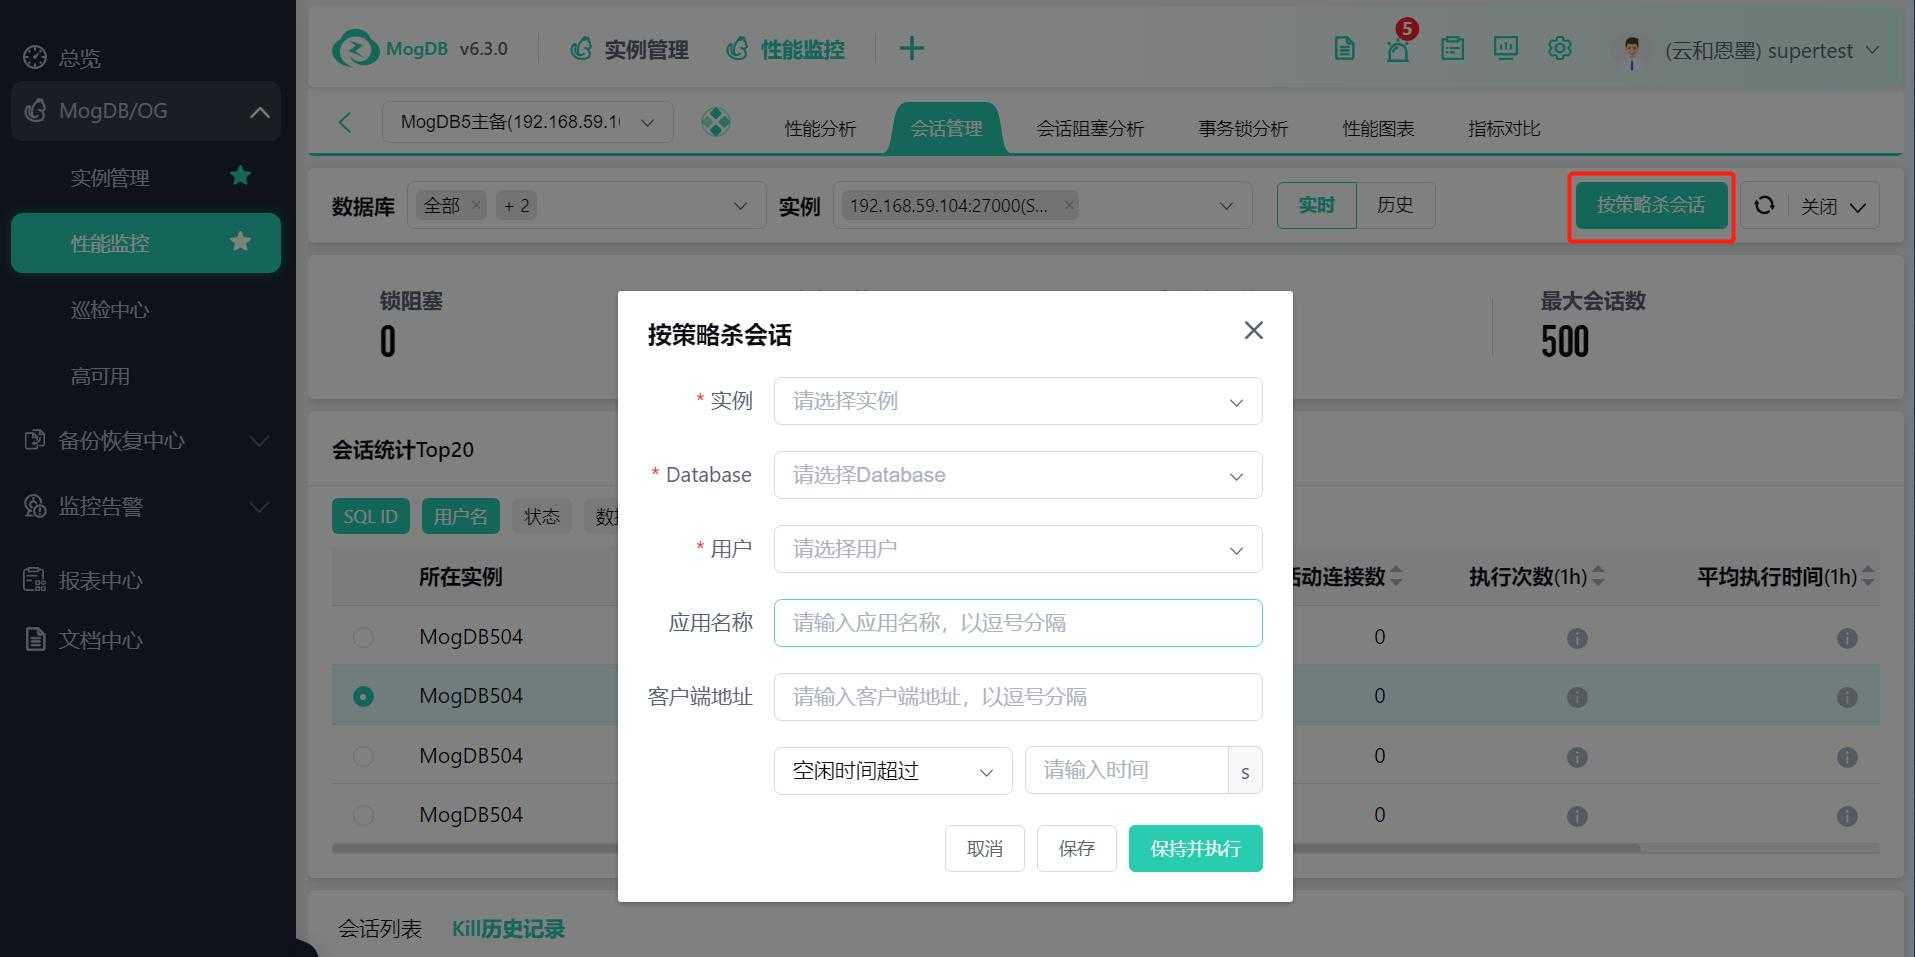
Session Killing by Strategy
① Click the 【Session Killing by Strategy】button to display the session killing by strategy popup. Edit the strategy information in the popup, click the 【Save】button to save the current edited strategy information, and click the 【Execute】button to execute the current strategy.
Historical Session Management
Session Statistics TOP20 List
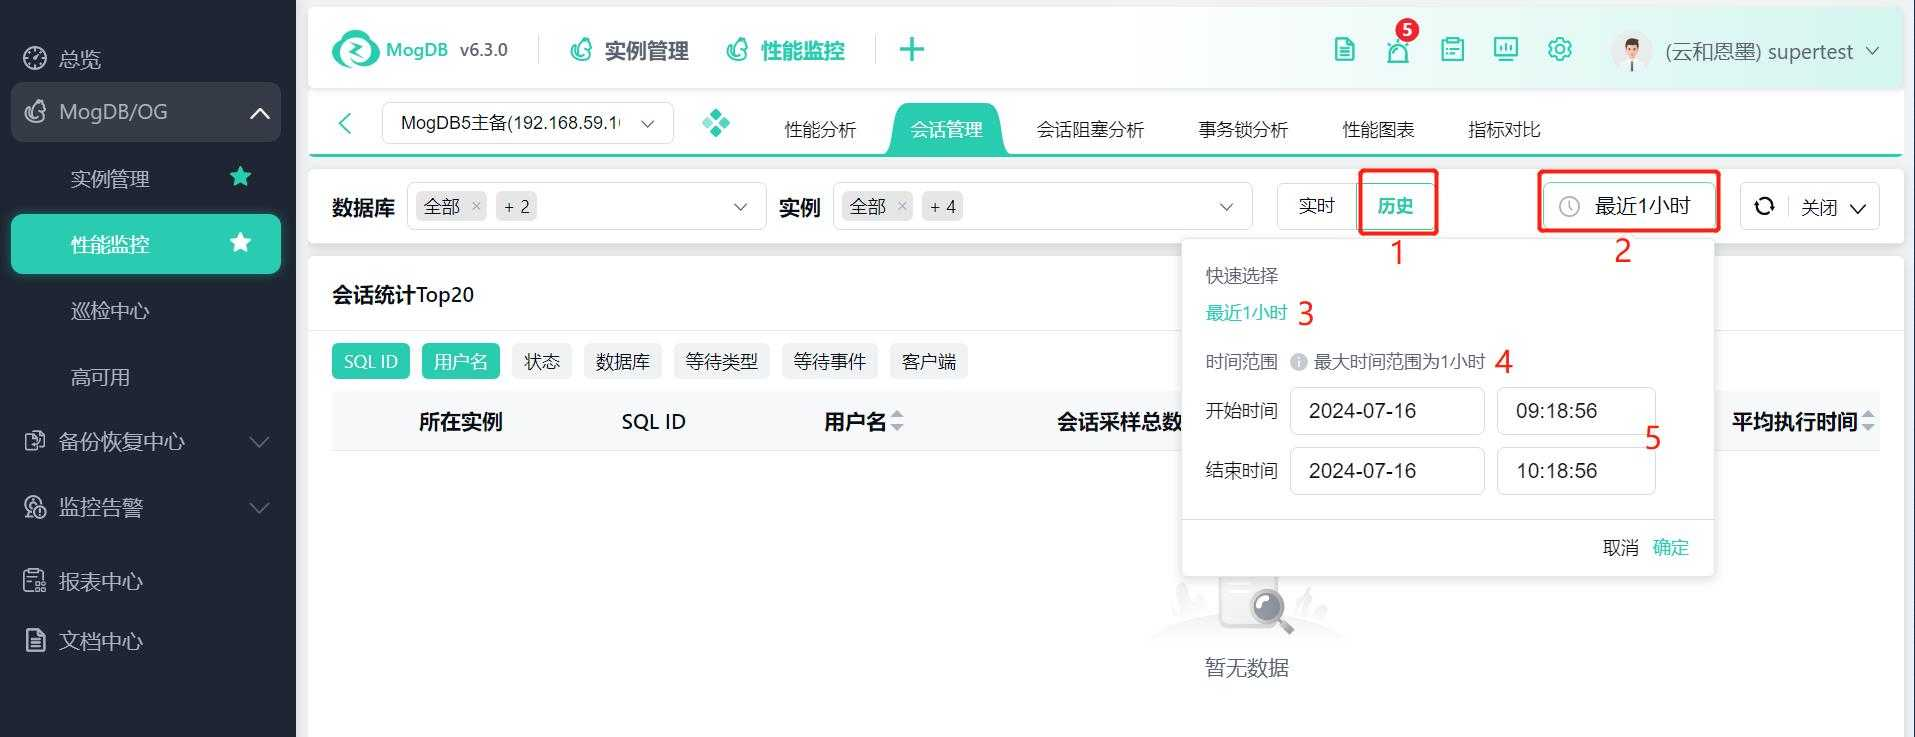
① On the session management page, click the 【History】Tab button to jump to the session management history page. The page displays historical session information within the user-selected time range. Users can select different time ranges ② to view the historical session information within the selected time range.
② Time Selection: Click the 【Time Selector】to choose the time range for the session history you want to view.
③ Quick Time Range Selection.
④ The maximum time range for the session management history page is 1 hour.
⑤ You can set the start time and end time through the custom time range.