- About MogDB
- Quick Start
- MogDB Playground
- Container-based MogDB Installation
- Installation on a Single Node
- MogDB Access
- Use CLI to Access MogDB
- Use GUI to Access MogDB
- Use Middleware to Access MogDB
- Use Programming Language to Access MogDB
- Using Sample Dataset Mogila
- Characteristic Description
- High Performance
- High Availability (HA)
- Maintainability
- Database Security
- Access Control Model
- Separation of Control and Access Permissions
- Database Encryption Authentication
- Data Encryption and Storage
- Database Audit
- Network Communication Security
- Resource Label
- Unified Audit
- Dynamic Data Anonymization
- Row-Level Access Control
- Password Strength Verification
- Equality Query in a Fully-encrypted Database
- Ledger Database Mechanism
- Enterprise-Level Features
- Support for Functions and Stored Procedures
- SQL Hints
- Full-Text Indexing
- Copy Interface for Error Tolerance
- Partitioning
- Support for Advanced Analysis Functions
- Materialized View
- HyperLogLog
- Creating an Index Online
- Autonomous Transaction
- Global Temporary Table
- Pseudocolumn ROWNUM
- Stored Procedure Debugging
- JDBC Client Load Balancing and Read/Write Isolation
- In-place Update Storage Engine
- Application Development Interfaces
- AI Capabilities
- Installation Guide
- Container Installation
- Simplified Installation Process
- Standard Installation
- Manual Installation
- Administrator Guide
- Routine Maintenance
- Starting and Stopping MogDB
- Using the gsql Client for Connection
- Routine Maintenance
- Checking OS Parameters
- Checking MogDB Health Status
- Checking Database Performance
- Checking and Deleting Logs
- Checking Time Consistency
- Checking The Number of Application Connections
- Routinely Maintaining Tables
- Routinely Recreating an Index
- Data Security Maintenance Suggestions
- Log Reference
- Primary and Standby Management
- MOT Engine
- Introducing MOT
- Using MOT
- Concepts of MOT
- Appendix
- Column-store Tables Management
- Backup and Restoration
- Importing and Exporting Data
- Importing Data
- Exporting Data
- Upgrade Guide
- Routine Maintenance
- AI Features Guide
- Overview
- Predictor: AI Query Time Forecasting
- X-Tuner: Parameter Optimization and Diagnosis
- SQLdiag: Slow SQL Discovery
- A-Detection: Status Monitoring
- Index-advisor: Index Recommendation
- DeepSQL
- AI-Native Database (DB4AI)
- Security Guide
- Developer Guide
- Application Development Guide
- Development Specifications
- Development Based on JDBC
- Overview
- JDBC Package, Driver Class, and Environment Class
- Development Process
- Loading the Driver
- Connecting to a Database
- Connecting to the Database (Using SSL)
- Running SQL Statements
- Processing Data in a Result Set
- Closing a Connection
- Managing Logs
- Example: Common Operations
- Example: Retrying SQL Queries for Applications
- Example: Importing and Exporting Data Through Local Files
- Example 2: Migrating Data from a MY Database to MogDB
- Example: Logic Replication Code
- Example: Parameters for Connecting to the Database in Different Scenarios
- JDBC API Reference
- java.sql.Connection
- java.sql.CallableStatement
- java.sql.DatabaseMetaData
- java.sql.Driver
- java.sql.PreparedStatement
- java.sql.ResultSet
- java.sql.ResultSetMetaData
- java.sql.Statement
- javax.sql.ConnectionPoolDataSource
- javax.sql.DataSource
- javax.sql.PooledConnection
- javax.naming.Context
- javax.naming.spi.InitialContextFactory
- CopyManager
- Development Based on ODBC
- Development Based on libpq
- Development Based on libpq
- libpq API Reference
- Database Connection Control Functions
- Database Statement Execution Functions
- Functions for Asynchronous Command Processing
- Functions for Canceling Queries in Progress
- Example
- Connection Characters
- Psycopg-Based Development
- Commissioning
- Appendices
- Stored Procedure
- User Defined Functions
- PL/pgSQL-SQL Procedural Language
- Scheduled Jobs
- Autonomous Transaction
- Logical Replication
- Logical Decoding
- Foreign Data Wrapper
- Materialized View
- Materialized View Overview
- Full Materialized View
- Incremental Materialized View
- Resource Load Management
- Overview
- Resource Management Preparation
- Application Development Guide
- Performance Tuning Guide
- System Optimization
- SQL Optimization
- WDR Snapshot Schema
- TPCC Performance Tuning Guide
- Reference Guide
- System Catalogs and System Views
- Overview of System Catalogs and System Views
- System Catalogs
- GS_AUDITING_POLICY
- GS_AUDITING_POLICY_ACCESS
- GS_AUDITING_POLICY_FILTERS
- GS_AUDITING_POLICY_PRIVILEGES
- GS_CLIENT_GLOBAL_KEYS
- GS_CLIENT_GLOBAL_KEYS_ARGS
- GS_COLUMN_KEYS
- GS_COLUMN_KEYS_ARGS
- GS_ENCRYPTED_COLUMNS
- GS_ENCRYPTED_PROC
- GS_GLOBAL_CHAIN
- GS_MASKING_POLICY
- GS_MASKING_POLICY_ACTIONS
- GS_MASKING_POLICY_FILTERS
- GS_MATVIEW
- GS_MATVIEW_DEPENDENCY
- GS_OPT_MODEL
- GS_POLICY_LABEL
- GS_RECYCLEBIN
- GS_TXN_SNAPSHOT
- GS_WLM_INSTANCE_HISTORY
- GS_WLM_OPERATOR_INFO
- GS_WLM_PLAN_ENCODING_TABLE
- GS_WLM_PLAN_OPERATOR_INFO
- GS_WLM_EC_OPERATOR_INFO
- PG_AGGREGATE
- PG_AM
- PG_AMOP
- PG_AMPROC
- PG_APP_WORKLOADGROUP_MAPPING
- PG_ATTRDEF
- PG_ATTRIBUTE
- PG_AUTHID
- PG_AUTH_HISTORY
- PG_AUTH_MEMBERS
- PG_CAST
- PG_CLASS
- PG_COLLATION
- PG_CONSTRAINT
- PG_CONVERSION
- PG_DATABASE
- PG_DB_ROLE_SETTING
- PG_DEFAULT_ACL
- PG_DEPEND
- PG_DESCRIPTION
- PG_DIRECTORY
- PG_ENUM
- PG_EXTENSION
- PG_EXTENSION_DATA_SOURCE
- PG_FOREIGN_DATA_WRAPPER
- PG_FOREIGN_SERVER
- PG_FOREIGN_TABLE
- PG_INDEX
- PG_INHERITS
- PG_JOB
- PG_JOB_PROC
- PG_LANGUAGE
- PG_LARGEOBJECT
- PG_LARGEOBJECT_METADATA
- PG_NAMESPACE
- PG_OBJECT
- PG_OPCLASS
- PG_OPERATOR
- PG_OPFAMILY
- PG_PARTITION
- PG_PLTEMPLATE
- PG_PROC
- PG_RANGE
- PG_RESOURCE_POOL
- PG_REWRITE
- PG_RLSPOLICY
- PG_SECLABEL
- PG_SHDEPEND
- PG_SHDESCRIPTION
- PG_SHSECLABEL
- PG_STATISTIC
- PG_STATISTIC_EXT
- PG_SYNONYM
- PG_TABLESPACE
- PG_TRIGGER
- PG_TS_CONFIG
- PG_TS_CONFIG_MAP
- PG_TS_DICT
- PG_TS_PARSER
- PG_TS_TEMPLATE
- PG_TYPE
- PG_USER_MAPPING
- PG_USER_STATUS
- PG_WORKLOAD_GROUP
- PLAN_TABLE_DATA
- STATEMENT_HISTORY
- System Views
- GET_GLOBAL_PREPARED_XACTS
- GS_AUDITING
- GS_AUDITING_ACCESS
- GS_AUDITING_PRIVILEGE
- GS_CLUSTER_RESOURCE_INFO
- GS_INSTANCE_TIME
- GS_LABELS
- GS_MASKING
- GS_MATVIEWS
- GS_SESSION_MEMORY
- GS_SESSION_CPU_STATISTICS
- GS_SESSION_MEMORY_CONTEXT
- GS_SESSION_MEMORY_DETAIL
- GS_SESSION_MEMORY_STATISTICS
- GS_SQL_COUNT
- GS_WLM_CGROUP_INFO
- GS_WLM_PLAN_OPERATOR_HISTORY
- GS_WLM_REBUILD_USER_RESOURCE_POOL
- GS_WLM_RESOURCE_POOL
- GS_WLM_USER_INFO
- GS_STAT_SESSION_CU
- GS_TOTAL_MEMORY_DETAIL
- MPP_TABLES
- PG_AVAILABLE_EXTENSION_VERSIONS
- PG_AVAILABLE_EXTENSIONS
- PG_COMM_DELAY
- PG_COMM_RECV_STREAM
- PG_COMM_SEND_STREAM
- PG_COMM_STATUS
- PG_CONTROL_GROUP_CONFIG
- PG_CURSORS
- PG_EXT_STATS
- PG_GET_INVALID_BACKENDS
- PG_GET_SENDERS_CATCHUP_TIME
- PG_GROUP
- PG_GTT_RELSTATS
- PG_GTT_STATS
- PG_GTT_ATTACHED_PIDS
- PG_INDEXES
- PG_LOCKS
- PG_NODE_ENV
- PG_OS_THREADS
- PG_PREPARED_STATEMENTS
- PG_PREPARED_XACTS
- PG_REPLICATION_SLOTS
- PG_RLSPOLICIES
- PG_ROLES
- PG_RULES
- PG_SECLABELS
- PG_SETTINGS
- PG_SHADOW
- PG_STATS
- PG_STAT_ACTIVITY
- PG_STAT_ALL_INDEXES
- PG_STAT_ALL_TABLES
- PG_STAT_BAD_BLOCK
- PG_STAT_BGWRITER
- PG_STAT_DATABASE
- PG_STAT_DATABASE_CONFLICTS
- PG_STAT_USER_FUNCTIONS
- PG_STAT_USER_INDEXES
- PG_STAT_USER_TABLES
- PG_STAT_REPLICATION
- PG_STAT_SYS_INDEXES
- PG_STAT_SYS_TABLES
- PG_STAT_XACT_ALL_TABLES
- PG_STAT_XACT_SYS_TABLES
- PG_STAT_XACT_USER_FUNCTIONS
- PG_STAT_XACT_USER_TABLES
- PG_STATIO_ALL_INDEXES
- PG_STATIO_ALL_SEQUENCES
- PG_STATIO_ALL_TABLES
- PG_STATIO_SYS_INDEXES
- PG_STATIO_SYS_SEQUENCES
- PG_STATIO_SYS_TABLES
- PG_STATIO_USER_INDEXES
- PG_STATIO_USER_SEQUENCES
- PG_STATIO_USER_TABLES
- PG_TABLES
- PG_TDE_INFO
- PG_THREAD_WAIT_STATUS
- PG_TIMEZONE_ABBREVS
- PG_TIMEZONE_NAMES
- PG_TOTAL_MEMORY_DETAIL
- PG_TOTAL_USER_RESOURCE_INFO
- PG_TOTAL_USER_RESOURCE_INFO_OID
- PG_USER
- PG_USER_MAPPINGS
- PG_VARIABLE_INFO
- PG_VIEWS
- PLAN_TABLE
- GS_FILE_STAT
- GS_OS_RUN_INFO
- GS_REDO_STAT
- GS_SESSION_STAT
- GS_SESSION_TIME
- GS_THREAD_MEMORY_CONTEXT
- Functions and Operators
- Logical Operators
- Comparison Operators
- Character Processing Functions and Operators
- Binary String Functions and Operators
- Bit String Functions and Operators
- Mode Matching Operators
- Mathematical Functions and Operators
- Date and Time Processing Functions and Operators
- Type Conversion Functions
- Geometric Functions and Operators
- Network Address Functions and Operators
- Text Search Functions and Operators
- JSON/JSONB Functions and Operators
- HLL Functions and Operators
- SEQUENCE Functions
- Array Functions and Operators
- Range Functions and Operators
- Aggregate Functions
- Window Functions
- Security Functions
- Ledger Database Functions
- Encrypted Equality Functions
- Set Returning Functions
- Conditional Expression Functions
- System Information Functions
- System Administration Functions
- Configuration Settings Functions
- Universal File Access Functions
- Server Signal Functions
- Backup and Restoration Control Functions
- Snapshot Synchronization Functions
- Database Object Functions
- Advisory Lock Functions
- Logical Replication Functions
- Segment-Page Storage Functions
- Other Functions
- Undo System Functions
- Statistics Information Functions
- Trigger Functions
- Hash Function
- Prompt Message Function
- Global Temporary Table Functions
- Fault Injection System Function
- AI Feature Functions
- Dynamic Data Masking Functions
- Other System Functions
- Internal Functions
- Obsolete Functions
- Supported Data Types
- Numeric Types
- Monetary Types
- Boolean Types
- Enumerated Types
- Character Types
- Binary Types
- Date/Time Types
- Geometric
- Network Address Types
- Bit String Types
- Text Search Types
- UUID
- JSON/JSONB Types
- HLL
- Array Types
- Range
- OID Types
- Pseudo-Types
- Data Types Supported by Column-store Tables
- XML Types
- Data Type Used by the Ledger Database
- SQL Syntax
- ABORT
- ALTER AGGREGATE
- ALTER AUDIT POLICY
- ALTER DATABASE
- ALTER DATA SOURCE
- ALTER DEFAULT PRIVILEGES
- ALTER DIRECTORY
- ALTER EXTENSION
- ALTER FOREIGN TABLE
- ALTER FUNCTION
- ALTER GROUP
- ALTER INDEX
- ALTER LANGUAGE
- ALTER LARGE OBJECT
- ALTER MASKING POLICY
- ALTER MATERIALIZED VIEW
- ALTER OPERATOR
- ALTER RESOURCE LABEL
- ALTER RESOURCE POOL
- ALTER ROLE
- ALTER ROW LEVEL SECURITY POLICY
- ALTER RULE
- ALTER SCHEMA
- ALTER SEQUENCE
- ALTER SERVER
- ALTER SESSION
- ALTER SYNONYM
- ALTER SYSTEM KILL SESSION
- ALTER SYSTEM SET
- ALTER TABLE
- ALTER TABLE PARTITION
- ALTER TABLE SUBPARTITION
- ALTER TABLESPACE
- ALTER TEXT SEARCH CONFIGURATION
- ALTER TEXT SEARCH DICTIONARY
- ALTER TRIGGER
- ALTER TYPE
- ALTER USER
- ALTER USER MAPPING
- ALTER VIEW
- ANALYZE | ANALYSE
- BEGIN
- CALL
- CHECKPOINT
- CLEAN CONNECTION
- CLOSE
- CLUSTER
- COMMENT
- COMMIT | END
- COMMIT PREPARED
- CONNECT BY
- COPY
- CREATE AGGREGATE
- CREATE AUDIT POLICY
- CREATE CAST
- CREATE CLIENT MASTER KEY
- CREATE COLUMN ENCRYPTION KEY
- CREATE DATABASE
- CREATE DATA SOURCE
- CREATE DIRECTORY
- CREATE EXTENSION
- CREATE FOREIGN TABLE
- CREATE FUNCTION
- CREATE GROUP
- CREATE INCREMENTAL MATERIALIZED VIEW
- CREATE INDEX
- CREATE LANGUAGE
- CREATE MASKING POLICY
- CREATE MATERIALIZED VIEW
- CREATE MODEL
- CREATE OPERATOR
- CREATE PACKAGE
- CREATE ROW LEVEL SECURITY POLICY
- CREATE PROCEDURE
- CREATE RESOURCE LABEL
- CREATE RESOURCE POOL
- CREATE ROLE
- CREATE RULE
- CREATE SCHEMA
- CREATE SEQUENCE
- CREATE SERVER
- CREATE SYNONYM
- CREATE TABLE
- CREATE TABLE AS
- CREATE TABLE PARTITION
- CREATE TABLE SUBPARTITION
- CREATE TABLESPACE
- CREATE TEXT SEARCH CONFIGURATION
- CREATE TEXT SEARCH DICTIONARY
- CREATE TRIGGER
- CREATE TYPE
- CREATE USER
- CREATE USER MAPPING
- CREATE VIEW
- CREATE WEAK PASSWORD DICTIONARY
- CURSOR
- DEALLOCATE
- DECLARE
- DELETE
- DO
- DROP AGGREGATE
- DROP AUDIT POLICY
- DROP CAST
- DROP CLIENT MASTER KEY
- DROP COLUMN ENCRYPTION KEY
- DROP DATABASE
- DROP DATA SOURCE
- DROP DIRECTORY
- DROP EXTENSION
- DROP FOREIGN TABLE
- DROP FUNCTION
- DROP GROUP
- DROP INDEX
- DROP LANGUAGE
- DROP MASKING POLICY
- DROP MATERIALIZED VIEW
- DROP MODEL
- DROP OPERATOR
- DROP OWNED
- DROP PACKAGE
- DROP PROCEDURE
- DROP RESOURCE LABEL
- DROP RESOURCE POOL
- DROP ROW LEVEL SECURITY POLICY
- DROP ROLE
- DROP RULE
- DROP SCHEMA
- DROP SEQUENCE
- DROP SERVER
- DROP SYNONYM
- DROP TABLE
- DROP TABLESPACE
- DROP TEXT SEARCH CONFIGURATION
- DROP TEXT SEARCH DICTIONARY
- DROP TRIGGER
- DROP TYPE
- DROP USER
- DROP USER MAPPING
- DROP VIEW
- DROP WEAK PASSWORD DICTIONARY
- EXECUTE
- EXECUTE DIRECT
- EXPLAIN
- EXPLAIN PLAN
- FETCH
- GRANT
- INSERT
- LOCK
- MOVE
- MERGE INTO
- PREDICT BY
- PREPARE
- PREPARE TRANSACTION
- PURGE
- REASSIGN OWNED
- REFRESH INCREMENTAL MATERIALIZED VIEW
- REFRESH MATERIALIZED VIEW
- REINDEX
- RELEASE SAVEPOINT
- RESET
- REVOKE
- ROLLBACK
- ROLLBACK PREPARED
- ROLLBACK TO SAVEPOINT
- SAVEPOINT
- SELECT
- SELECT INTO
- SET
- SET CONSTRAINTS
- SET ROLE
- SET SESSION AUTHORIZATION
- SET TRANSACTION
- SHOW
- SHUTDOWN
- SNAPSHOT
- START TRANSACTION
- TIMECAPSULE TABLE
- TRUNCATE
- UPDATE
- VACUUM
- VALUES
- SQL Reference
- MogDB SQL
- Keywords
- Constant and Macro
- Expressions
- Type Conversion
- Full Text Search
- Introduction
- Tables and Indexes
- Controlling Text Search
- Additional Features
- Parser
- Dictionaries
- Configuration Examples
- Testing and Debugging Text Search
- Limitations
- System Operation
- Controlling Transactions
- DDL Syntax Overview
- DML Syntax Overview
- DCL Syntax Overview
- Appendix
- GUC Parameters
- GUC Parameter Usage
- File Location
- Connection and Authentication
- Resource Consumption
- Parallel Import
- Write Ahead Log
- HA Replication
- Memory Table
- Query Planning
- Error Reporting and Logging
- Alarm Detection
- Statistics During the Database Running
- Load Management
- Automatic Vacuuming
- Default Settings of Client Connection
- Lock Management
- Version and Platform Compatibility
- Faut Tolerance
- Connection Pool Parameters
- MogDB Transaction
- Developer Options
- Auditing
- Upgrade Parameters
- Miscellaneous Parameters
- Wait Events
- Query
- System Performance Snapshot
- Security Configuration
- Global Temporary Table
- HyperLogLog
- Scheduled Task
- Thread Pool
- User-defined Functions
- Backup and Restoration
- Undo
- DCF Parameters Settings
- Flashback
- Rollback Parameters
- Reserved Parameters
- AI Features
- Appendix
- Schema
- Information Schema
- DBE_PERF
- Overview
- OS
- Instance
- Memory
- File
- Object
- STAT_USER_TABLES
- SUMMARY_STAT_USER_TABLES
- GLOBAL_STAT_USER_TABLES
- STAT_USER_INDEXES
- SUMMARY_STAT_USER_INDEXES
- GLOBAL_STAT_USER_INDEXES
- STAT_SYS_TABLES
- SUMMARY_STAT_SYS_TABLES
- GLOBAL_STAT_SYS_TABLES
- STAT_SYS_INDEXES
- SUMMARY_STAT_SYS_INDEXES
- GLOBAL_STAT_SYS_INDEXES
- STAT_ALL_TABLES
- SUMMARY_STAT_ALL_TABLES
- GLOBAL_STAT_ALL_TABLES
- STAT_ALL_INDEXES
- SUMMARY_STAT_ALL_INDEXES
- GLOBAL_STAT_ALL_INDEXES
- STAT_DATABASE
- SUMMARY_STAT_DATABASE
- GLOBAL_STAT_DATABASE
- STAT_DATABASE_CONFLICTS
- SUMMARY_STAT_DATABASE_CONFLICTS
- GLOBAL_STAT_DATABASE_CONFLICTS
- STAT_XACT_ALL_TABLES
- SUMMARY_STAT_XACT_ALL_TABLES
- GLOBAL_STAT_XACT_ALL_TABLES
- STAT_XACT_SYS_TABLES
- SUMMARY_STAT_XACT_SYS_TABLES
- GLOBAL_STAT_XACT_SYS_TABLES
- STAT_XACT_USER_TABLES
- SUMMARY_STAT_XACT_USER_TABLES
- GLOBAL_STAT_XACT_USER_TABLES
- STAT_XACT_USER_FUNCTIONS
- SUMMARY_STAT_XACT_USER_FUNCTIONS
- GLOBAL_STAT_XACT_USER_FUNCTIONS
- STAT_BAD_BLOCK
- SUMMARY_STAT_BAD_BLOCK
- GLOBAL_STAT_BAD_BLOCK
- STAT_USER_FUNCTIONS
- SUMMARY_STAT_USER_FUNCTIONS
- GLOBAL_STAT_USER_FUNCTIONS
- Workload
- Session/Thread
- SESSION_STAT
- GLOBAL_SESSION_STAT
- SESSION_TIME
- GLOBAL_SESSION_TIME
- SESSION_MEMORY
- GLOBAL_SESSION_MEMORY
- SESSION_MEMORY_DETAIL
- GLOBAL_SESSION_MEMORY_DETAIL
- SESSION_STAT_ACTIVITY
- GLOBAL_SESSION_STAT_ACTIVITY
- THREAD_WAIT_STATUS
- GLOBAL_THREAD_WAIT_STATUS
- LOCAL_THREADPOOL_STATUS
- GLOBAL_THREADPOOL_STATUS
- SESSION_CPU_RUNTIME
- SESSION_MEMORY_RUNTIME
- STATEMENT_IOSTAT_COMPLEX_RUNTIME
- LOCAL_ACTIVE_SESSION
- Transaction
- Query
- STATEMENT
- SUMMARY_STATEMENT
- STATEMENT_COUNT
- GLOBAL_STATEMENT_COUNT
- SUMMARY_STATEMENT_COUNT
- GLOBAL_STATEMENT_COMPLEX_HISTORY
- GLOBAL_STATEMENT_COMPLEX_HISTORY_TABLE
- GLOBAL_STATEMENT_COMPLEX_RUNTIME
- STATEMENT_RESPONSETIME_PERCENTILE
- STATEMENT_USER_COMPLEX_HISTORY
- STATEMENT_COMPLEX_RUNTIME
- STATEMENT_COMPLEX_HISTORY_TABLE
- STATEMENT_COMPLEX_HISTORY
- STATEMENT_WLMSTAT_COMPLEX_RUNTIME
- STATEMENT_HISTORY
- Cache/IO
- STATIO_USER_TABLES
- SUMMARY_STATIO_USER_TABLES
- GLOBAL_STATIO_USER_TABLES
- STATIO_USER_INDEXES
- SUMMARY_STATIO_USER_INDEXES
- GLOBAL_STATIO_USER_INDEXES
- STATIO_USER_SEQUENCES
- SUMMARY_STATIO_USER_SEQUENCES
- GLOBAL_STATIO_USER_SEQUENCES
- STATIO_SYS_TABLES
- SUMMARY_STATIO_SYS_TABLES
- GLOBAL_STATIO_SYS_TABLES
- STATIO_SYS_INDEXES
- SUMMARY_STATIO_SYS_INDEXES
- GLOBAL_STATIO_SYS_INDEXES
- STATIO_SYS_SEQUENCES
- SUMMARY_STATIO_SYS_SEQUENCES
- GLOBAL_STATIO_SYS_SEQUENCES
- STATIO_ALL_TABLES
- SUMMARY_STATIO_ALL_TABLES
- GLOBAL_STATIO_ALL_TABLES
- STATIO_ALL_INDEXES
- SUMMARY_STATIO_ALL_INDEXES
- GLOBAL_STATIO_ALL_INDEXES
- STATIO_ALL_SEQUENCES
- SUMMARY_STATIO_ALL_SEQUENCES
- GLOBAL_STATIO_ALL_SEQUENCES
- GLOBAL_STAT_DB_CU
- GLOBAL_STAT_SESSION_CU
- Utility
- REPLICATION_STAT
- GLOBAL_REPLICATION_STAT
- REPLICATION_SLOTS
- GLOBAL_REPLICATION_SLOTS
- BGWRITER_STAT
- GLOBAL_BGWRITER_STAT
- GLOBAL_CKPT_STATUS
- GLOBAL_DOUBLE_WRITE_STATUS
- GLOBAL_PAGEWRITER_STATUS
- GLOBAL_RECORD_RESET_TIME
- GLOBAL_REDO_STATUS
- GLOBAL_RECOVERY_STATUS
- CLASS_VITAL_INFO
- USER_LOGIN
- SUMMARY_USER_LOGIN
- GLOBAL_GET_BGWRITER_STATUS
- GLOBAL_SINGLE_FLUSH_DW_STATUS
- GLOBAL_CANDIDATE_STATUS
- Lock
- Wait Events
- Configuration
- Operator
- Workload Manager
- Global Plancache
- RTO
- Appendix
- DBE_PLDEBUGGER Schema
- Overview
- DBE_PLDEBUGGER.turn_on
- DBE_PLDEBUGGER.turn_off
- DBE_PLDEBUGGER.local_debug_server_info
- DBE_PLDEBUGGER.attach
- DBE_PLDEBUGGER.next
- DBE_PLDEBUGGER.continue
- DBE_PLDEBUGGER.abort
- DBE_PLDEBUGGER.print_var
- DBE_PLDEBUGGER.info_code
- DBE_PLDEBUGGER.step
- DBE_PLDEBUGGER.add_breakpoint
- DBE_PLDEBUGGER.delete_breakpoint
- DBE_PLDEBUGGER.info_breakpoints
- DBE_PLDEBUGGER.backtrace
- DBE_PLDEBUGGER.finish
- DBE_PLDEBUGGER.set_var
- DB4AI Schema
- Tool Reference
- Tool Overview
- Client Tool
- Server Tools
- Tools Used in the Internal System
- gaussdb
- gs_backup
- gs_basebackup
- gs_ctl
- gs_initdb
- gs_install
- gs_install_plugin
- gs_install_plugin_local
- gs_postuninstall
- gs_preinstall
- gs_sshexkey
- gs_tar
- gs_uninstall
- gs_upgradectl
- gs_expansion
- gs_dropnode
- gs_probackup
- gstrace
- kdb5_util
- kadmin.local
- kinit
- klist
- krb5kdc
- kdestroy
- pg_config
- pg_controldata
- pg_recvlogical
- pg_resetxlog
- pg_archivecleanup
- pssh
- pscp
- transfer.py
- FAQ
- System Catalogs and Views Supported by gs_collector
- Extension Reference
- Error Code Reference
- Description of SQL Error Codes
- Third-Party Library Error Codes
- GAUSS-00001 - GAUSS-00100
- GAUSS-00101 - GAUSS-00200
- GAUSS 00201 - GAUSS 00300
- GAUSS 00301 - GAUSS 00400
- GAUSS 00401 - GAUSS 00500
- GAUSS 00501 - GAUSS 00600
- GAUSS 00601 - GAUSS 00700
- GAUSS 00701 - GAUSS 00800
- GAUSS 00801 - GAUSS 00900
- GAUSS 00901 - GAUSS 01000
- GAUSS 01001 - GAUSS 01100
- GAUSS 01101 - GAUSS 01200
- GAUSS 01201 - GAUSS 01300
- GAUSS 01301 - GAUSS 01400
- GAUSS 01401 - GAUSS 01500
- GAUSS 01501 - GAUSS 01600
- GAUSS 01601 - GAUSS 01700
- GAUSS 01701 - GAUSS 01800
- GAUSS 01801 - GAUSS 01900
- GAUSS 01901 - GAUSS 02000
- GAUSS 02001 - GAUSS 02100
- GAUSS 02101 - GAUSS 02200
- GAUSS 02201 - GAUSS 02300
- GAUSS 02301 - GAUSS 02400
- GAUSS 02401 - GAUSS 02500
- GAUSS 02501 - GAUSS 02600
- GAUSS 02601 - GAUSS 02700
- GAUSS 02701 - GAUSS 02800
- GAUSS 02801 - GAUSS 02900
- GAUSS 02901 - GAUSS 03000
- GAUSS 03001 - GAUSS 03100
- GAUSS 03101 - GAUSS 03200
- GAUSS 03201 - GAUSS 03300
- GAUSS 03301 - GAUSS 03400
- GAUSS 03401 - GAUSS 03500
- GAUSS 03501 - GAUSS 03600
- GAUSS 03601 - GAUSS 03700
- GAUSS 03701 - GAUSS 03800
- GAUSS 03801 - GAUSS 03900
- GAUSS 03901 - GAUSS 04000
- GAUSS 04001 - GAUSS 04100
- GAUSS 04101 - GAUSS 04200
- GAUSS 04201 - GAUSS 04300
- GAUSS 04301 - GAUSS 04400
- GAUSS 04401 - GAUSS 04500
- GAUSS 04501 - GAUSS 04600
- GAUSS 04601 - GAUSS 04700
- GAUSS 04701 - GAUSS 04800
- GAUSS 04801 - GAUSS 04900
- GAUSS 04901 - GAUSS 05000
- GAUSS 05001 - GAUSS 05100
- GAUSS 05101 - GAUSS 05200
- GAUSS 05201 - GAUSS 05300
- GAUSS 05301 - GAUSS 05400
- GAUSS 05401 - GAUSS 05500
- GAUSS 05501 - GAUSS 05600
- GAUSS 05601 - GAUSS 05700
- GAUSS 05701 - GAUSS 05800
- GAUSS 05801 - GAUSS 05900
- GAUSS 05901 - GAUSS 06000
- GAUSS 06001 - GAUSS 06100
- GAUSS 06101 - GAUSS 06200
- GAUSS 06201 - GAUSS 06300
- GAUSS 06301 - GAUSS 06400
- GAUSS 06401 - GAUSS 06500
- GAUSS 06501 - GAUSS 06600
- GAUSS 06601 - GAUSS 06700
- GAUSS 06701 - GAUSS 06800
- GAUSS 06801 - GAUSS 06900
- GAUSS 06901 - GAUSS 07000
- GAUSS 07001 - GAUSS 07100
- GAUSS 07101 - GAUSS 07200
- GAUSS 07201 - GAUSS 07300
- GAUSS 07301 - GAUSS 07400
- GAUSS 07401 - GAUSS 07480
- GAUSS 50000 - GAUSS 50999
- GAUSS 51000 - GAUSS 51999
- GAUSS 52000 - GAUSS 52999
- GAUSS 53000 - GAUSS 53699
- Error Log Reference
- System Catalogs and System Views
- Common Faults and Identification Guide
- Common Fault Locating Methods
- Common Fault Locating Cases
- Core Fault Locating
- Permission/Session/Data Type Fault Location
- Service/High Availability/Concurrency Fault Location
- Table/Partition Table Fault Location
- File System/Disk/Memory Fault Location
- After You Run the du Command to Query Data File Size In the XFS File System, the Query Result Is Greater than the Actual File Size
- File Is Damaged in the XFS File System
- Insufficient Memory
- "Error:No space left on device" Is Displayed
- When the TPC-C is running and a disk to be injected is full, the TPC-C stops responding
- Disk Space Usage Reaches the Threshold and the Database Becomes Read-only
- SQL Fault Location
- Index Fault Location
- Source Code Parsing
- FAQs
- Glossary
System KPI-aided Diagnosis
Availability
This feature is available since MogDB 1.1.0.
Introduction
KPIs are views of key performance indicators for kernel components or the entire system. Based on KPIs, users can learn about the real-time and historical running status of the system.
Benefits
-
Summarized system load diagnosis
Precise alarms for system load exceptions (overload, stall, and SLA exceptions) and precise system load profile
-
Summarized system time model diagnosis
Instance-level and query-level time model segmentation, diagnosing the root causes of instance and query performance problems
-
Query performance diagnosis
Database-level query summary, including top SQL, SQL CPU usage, I/O consumption, execution plan, and excessive hard parsing
-
Diagnosis of disk I/O, index, and buffer performance problems
-
Diagnosis of connection and thread pool problems
-
Diagnosis of checkpoint and redo (RTO) performance problems
-
Diagnosis of system I/O, LWLock, and wait performance problems
Diagnosis of over 60 modules and over 240 key operation performance problems
-
Function-level performance monitoring and diagnosis (by GSTRACE)
Tracing of over 50 functions at the storage and execution layers
Description
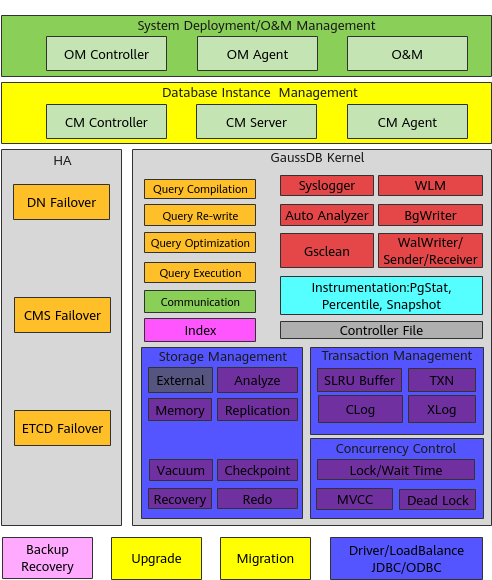
MogDB provides KPIs of 11 categories and 26 sub-categories, covering instances, files, objects, workload, communication, sessions, threads, cache I/O, locks, wait events, and clusters.
Figure 1 shows the distribution of kernel KPIs.
Figure 1 Distribution of kernel KPIs
Enhancements
None
Constraints
None
Dependencies
None