- About Uqbar
- Release Note
- Uqbar Installation
- Uqbar Management
- Data Retention Policy
- Time-Series Table Management
- Time-Series Data Write
- Data Compression
- Data Deletion
- Data Query
- Continuous Aggregation
- Time-Series Views
- Cluster Management
- Backup and Restoration
- Security
- GUC Parameters
- SQL Syntax
- Third Party Tools Support
- Glossary
Prometheus Usage Guideline
Overview
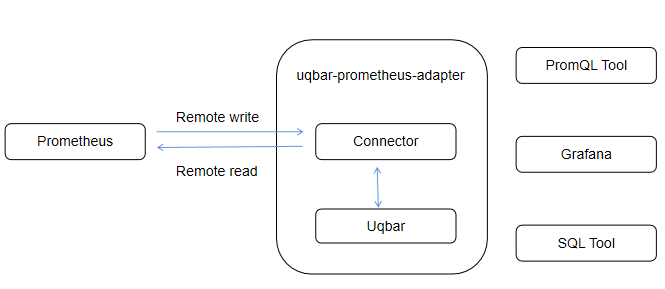
Uqbar supports the writing of Prometheus monitoring data into a time-series table through the uqbar-prometheus-adapter. The uqbar-prometheus-adapter serves as middleware bridging Prometheus and Uqbar. Leveraging Prometheus' support for remote storage, it converts external requests, such as PromSQL queries from tools like Grafana and data write requests from monitoring devices, into SQL statements. These SQL statements are then sent to Uqbar for writing monitoring data into the database or for retrieving query results from the database and returning them to Prometheus.
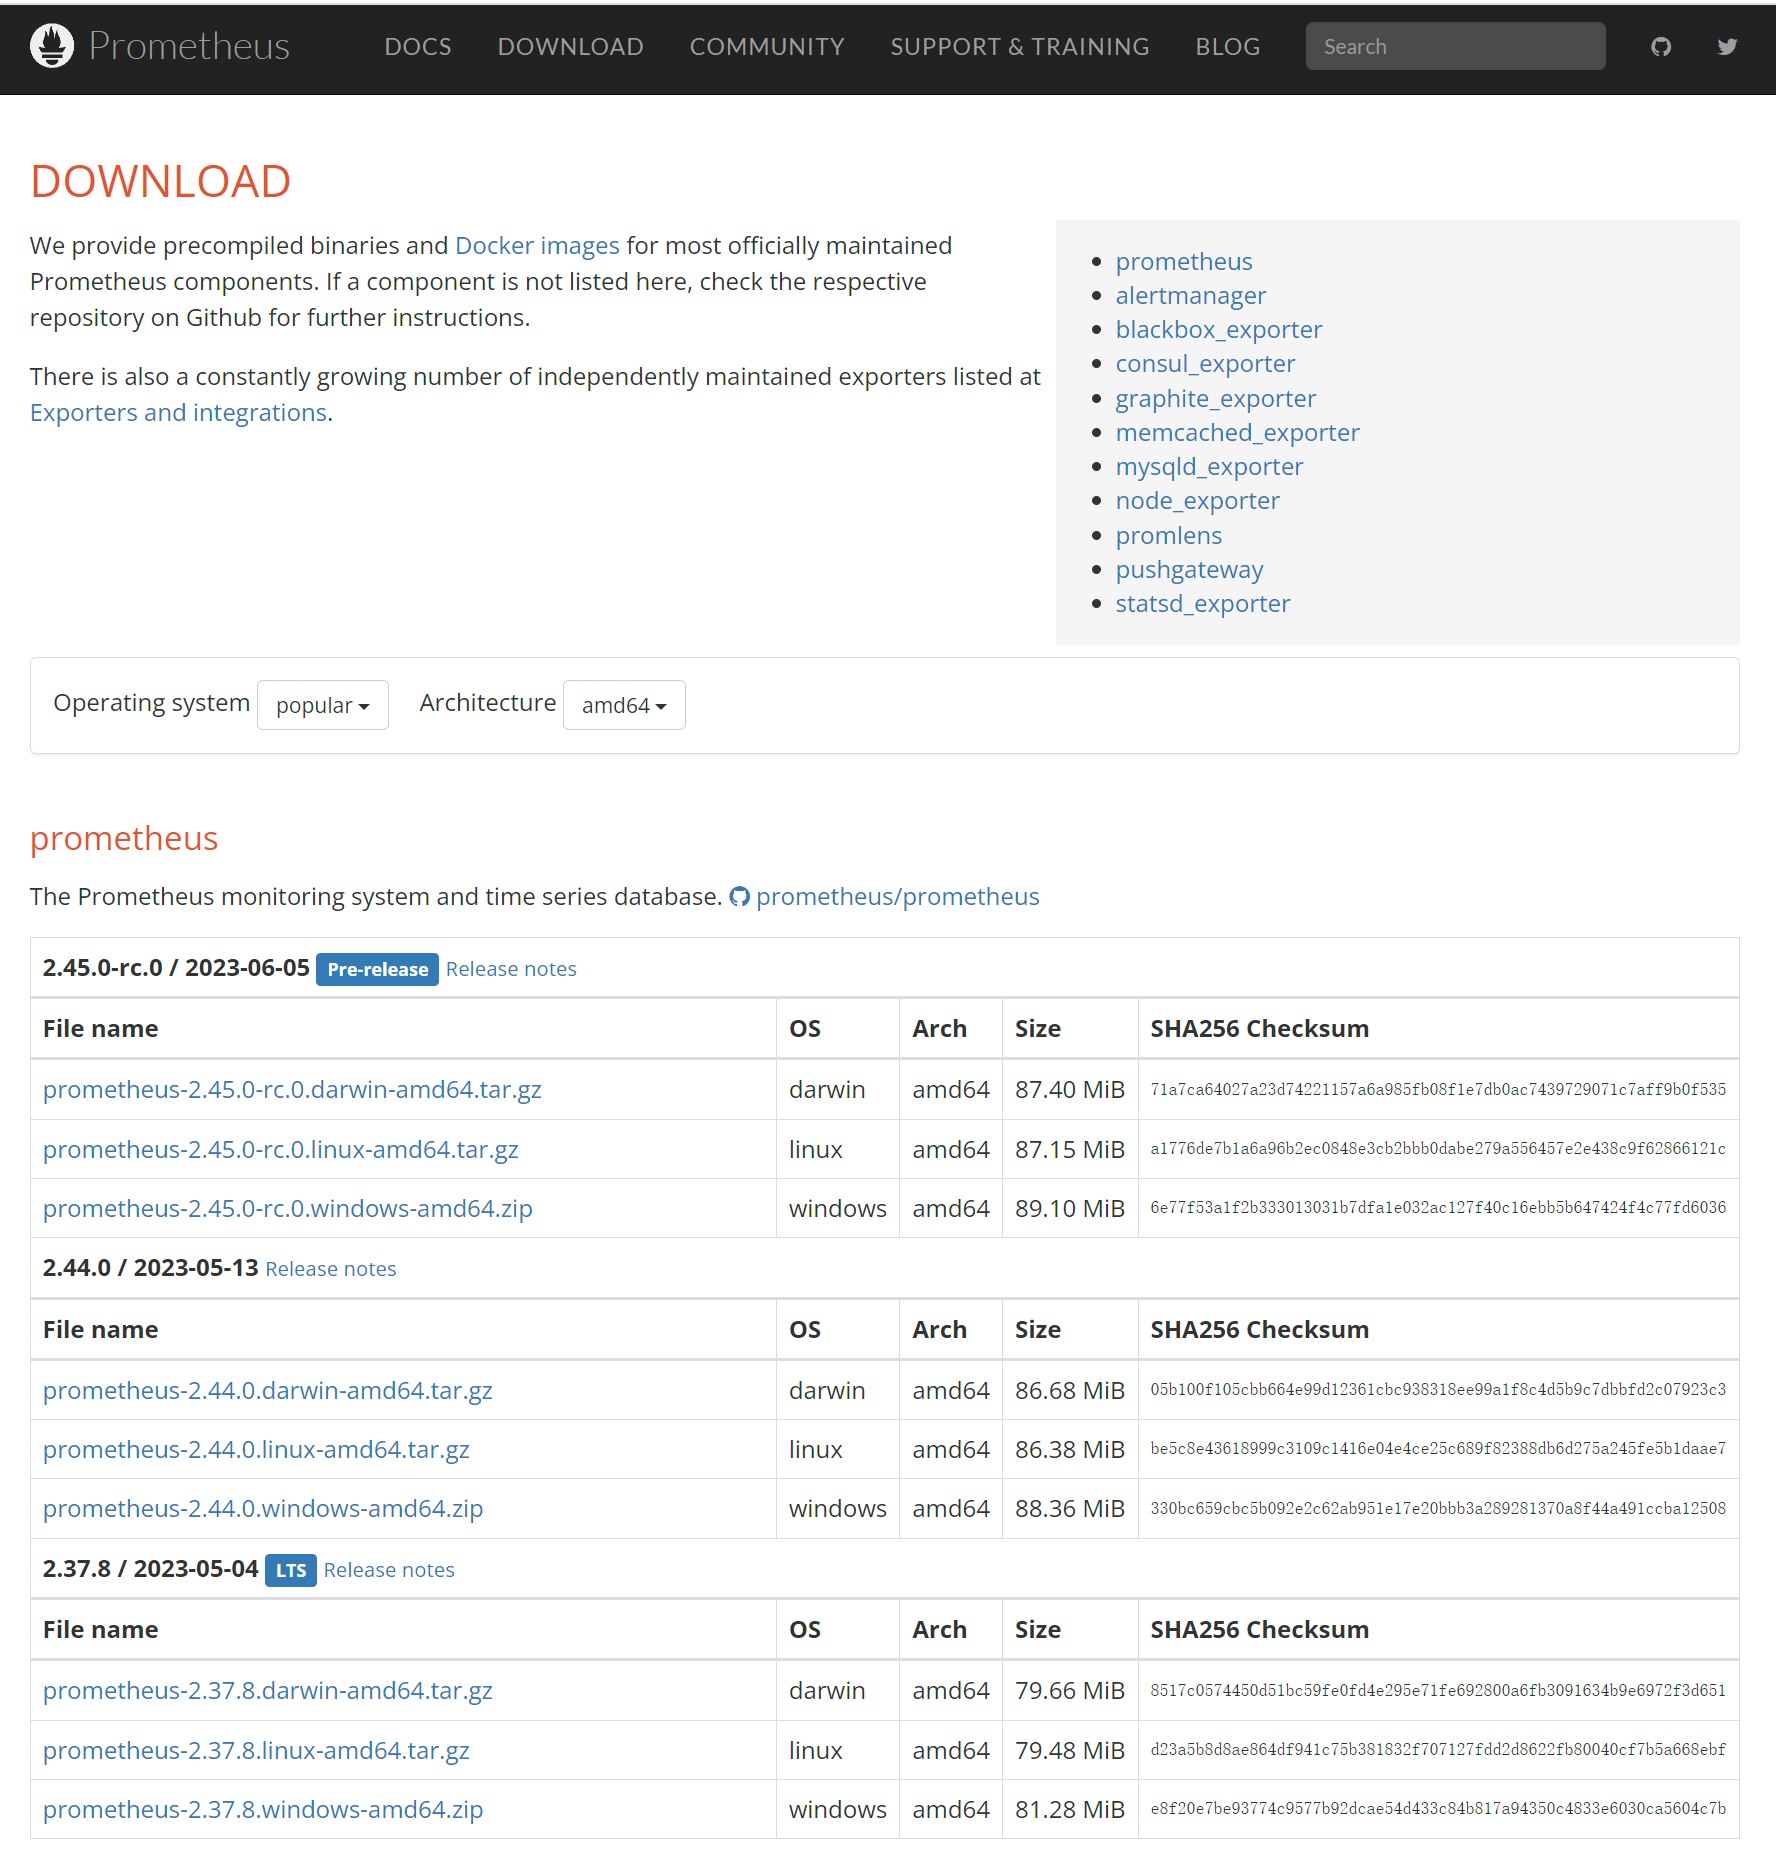
Install Prometheus
To download Prometheus, please visit https://prometheus.io/download/.
Modify The Prometheus Configuration File
Configure the Prometheus YAML file by adding remote storage settings. The minimal configuration is as follows:
global:
scrape_interval: 15s
evaluation_interval: 15s
alerting:
alertmanagers:
 - static_configs:
 - targets:
rule_files:
scrape_configs:
 - job_name: "prometheus"
scheme : "http"
static_configs:
 - targets: [ "localhost:9090"]
remote_write:
 - url: " http://localhost:9201/write"
remote_read:
 - url: "http://localhost:9201/read "
read_recent: true
The url in remote_write and remote_read is configured as the actual address of the uqbar-prometheus-adapter.
The above configuration is without TLS and without auth checking, for using TLS example is as follows:
global:
scrape_interval: 15s
evaluation_interval: 15s
alerting:
alertmanagers:
- static_configs:
- targets:
rule_files:
scrape_configs:
- job_name: "prometheus"
scheme : "http"
static_configs:
- targets: [ "localhost:9090"]
remote_write:
- url: " https://localhost:9201/write"
basic_auth:
username: "hello"
password: "world"
# =====================
# authorization:
# type: "Bearer"
# credentials: "QWxhZGRpbjpvcGVuIHNlc2FtZQ"
# =====================
tls_config:
ca_file: "xx/ca.crt"
cert_file: "xx/server.pem"
key_file: "xx/server.key"
remote_read:
- url: "https://localhost:9201/read"
read_recent: true
basic_auth:
username: "hello"
password: "world"
# =====================
# authorization:
# type: "Bearer"
# credentials: "QWxhZGRpbjpvcGVuIHNlc2FtZQ"
# =====================
tls_config:
ca_file: "xx/ca.crt"
cert_file: "xx/server.pem"
key_file: "xx/server.key"
Please note that the url parameter in remote_read and _remote_write should be set to https to make Prometheus' tsdb component send HTTPS requests to remote storage. Therefore, when using TLS, ensure that the url parameter is configured correctly. Otherwise, you may encounter issues where HTTP requests are sent to an HTTPS server, causing service disruptions.
Start Prometheus
Examples of startup parameters are shown below:
nohup ./prometheus --config.file=prometheus.yml &The uqbar-prometheus-adapter itself has configurable parameters that can be specified with --xx=xx when starting the service, see the following table for specific parameters and roles.
| Parameter Name | Description |
|---|---|
| config | Configuration file path |
| web-auth-username | User name for basic auth |
| web-auth-password | Password for basic auth |
| web-auth-password-file | Path to the file where the basic auth password is stored using the file |
| web-auth-bearer-token | bearer token |
| web-auth-bearer-token-file | File path to store bearer token using a file |
| web-listen-address | The address that the web service listens to, port 9201 is used by default |
| auth-tls-cert-file | TLS certification file |
| auth-tls-key-file | TLS key file |
| pg-commit-secs | Interval between writes to the database, 15 seconds by default |
| pg-commit-rows | Number of rows accumulated by writing to the database once |
| pg-threads | Number of goroutines writes to the database |
| parser-threads | Parsing prometheus metrics data goroutines counts |
| db-connurl | Database connection string, not empty direct use; for empty program to use other db parameters to construct their own |
| db-app-name | connect app name |
| db-ssl-mode | ssl mode default allow |
| db-conn-timeout | Timeout |
| db-user | User name |
| db-password | Password |
| db-host | Database host |
| db-port | Database service port |
| db-database | Database name |
| db-ssl-cert | The ssl certificate file used to connect to the database |
| db-ssl-key | The ssl key file used to connect to the database |
| db-ssl-ca | The CA file used to connect to the database |
The minimal startup command is as follows:
./uqbar-prometheus-adapter --db-host="localhost" --db-user=world --db-password="Test@123" --db-port=17680 --db-database="postgres"This tool also supports launching using a configuration file. The usage is --config=xx.yaml.
The configuration file uses the YAML format but requires a flat hierarchical structure, where all parameters are at the same level. Specifying parameters in both the command line and the configuration file will result in a failure to start and will generate a prompt.
Connect To Uqbar
-
Configure Prometheus monitoring tasks and remote storage.
-
Start the uqbar-prometheus-adapter tool, database password authentication must be in MD5 format.
-
Data successfully written to Uqbar.
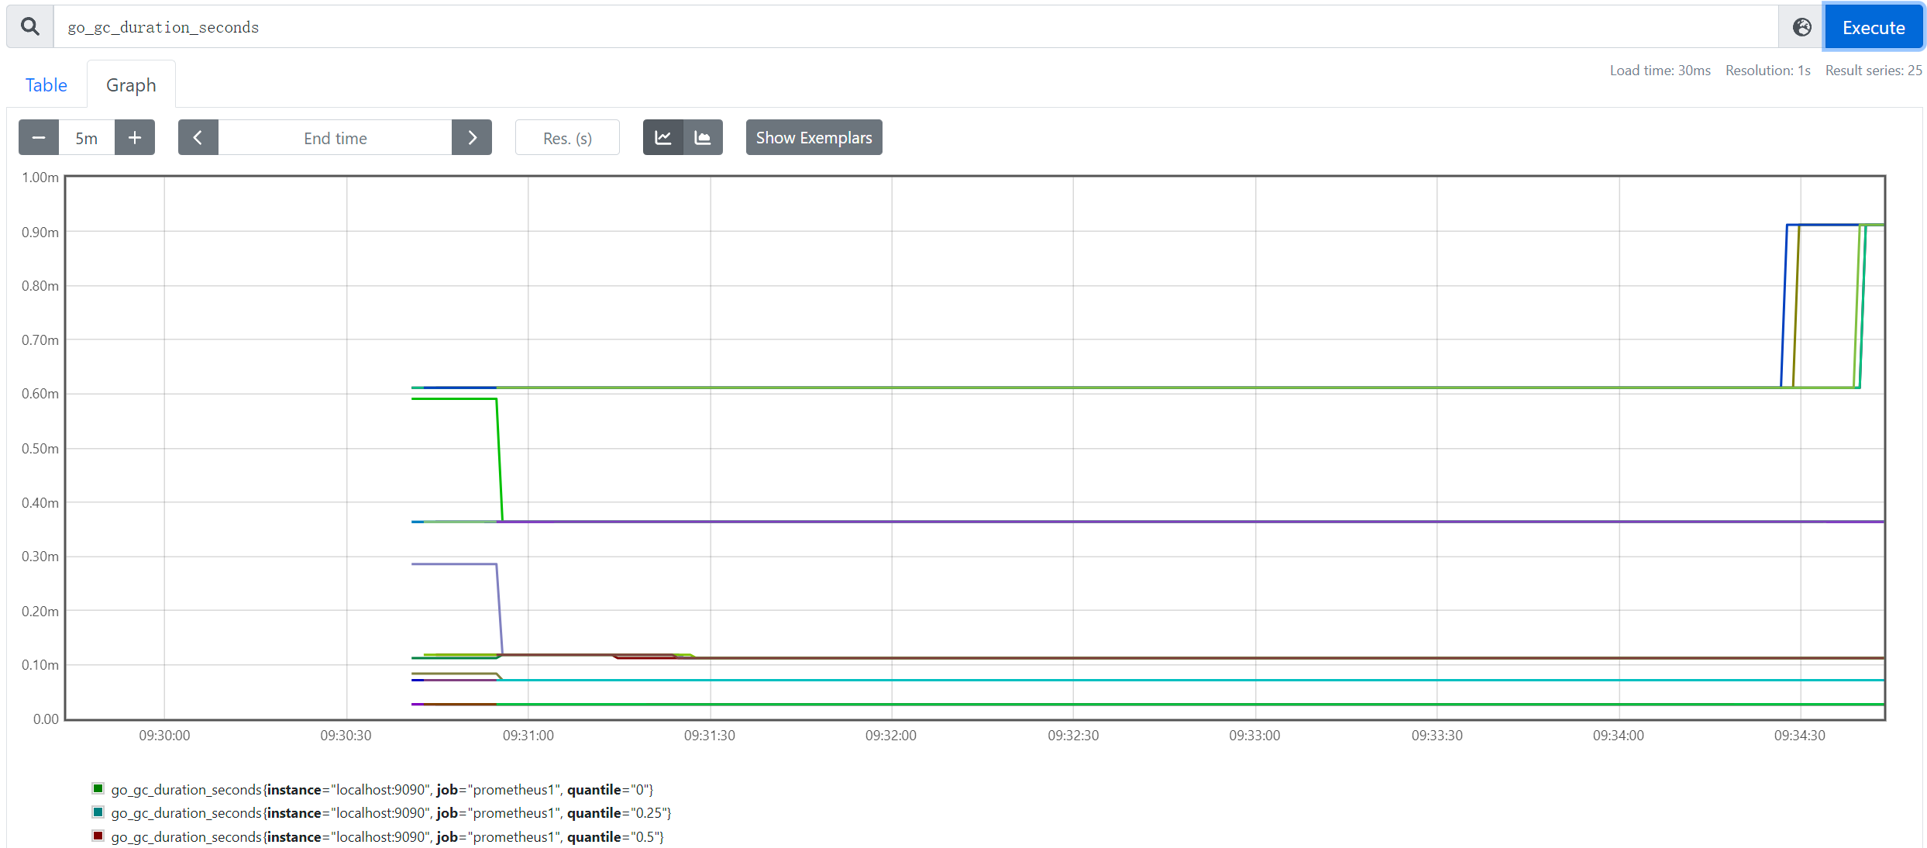
-
You can query the data that has been written using the Prometheus web UI (http://localhost:9090/graph).