- About Uqbar
- Release Note
- Uqbar Installation
- Uqbar Management
- Data Retention Policy
- Time-Series Table Management
- Time-Series Data Write
- Data Compression
- Data Deletion
- Data Query
- Continuous Aggregation
- Time-Series Views
- Cluster Management
- Backup and Restoration
- Security
- GUC Parameters
- SQL Syntax
- Third Party Tools Support
- Glossary
histogram()
Function Description
Used to generate histogram data for analyzing the distribution of time-series data. It helps to understand how values in a time-series data set are distributed within a given range and can be useful for identifying outliers or data skewness.
Syntax
SELECT histogram(column,min,max,num_buckets) FROM your_table;Parameter Description
-
column: The name of the column in the time-series table for which you want to generate the histogram.
-
min: The lower limit (inclusive) of the histogram range.
-
max: The upper limit (exclusive) of the histogram range.
-
nbuckets: Specifies the number of buckets in the generated histogram.
When computing the histogram, the range from min to max is evenly divided into nbuckets subintervals (left-closed and right-open). Values less than min are placed into a separate interval, and values greater than or equal to max are placed into another separate interval. In reality, the number of buckets will be nbuckets + 2. The histogram's calculation result shows the count of column values falling into each interval.
The purpose of the histogram function:
- Distribution Analysis: By generating a histogram, you can understand how values in time-series data are distributed within a specified range. Each bucket represents a value range, and it calculates the number of data points within that range. This helps in identifying distribution patterns, peaks, and outliers in the data.
- Skewness Detection: Histograms can be used to detect data skewness in time-series data. If a bucket has a significantly higher count than others, it indicates that there are more data points within that value range, suggesting potential data skewness or anomalies.
- Data Segmentation: By dividing time-series data into multiple buckets, you can perform coarse-grained partitioning or grouping of data. This helps in gaining a better understanding of the composition and distribution of the dataset and provides more efficient aggregation calculations during queries and analysis.
Examples
The following example demonstrates how to use the histogram function to generate histogram data:
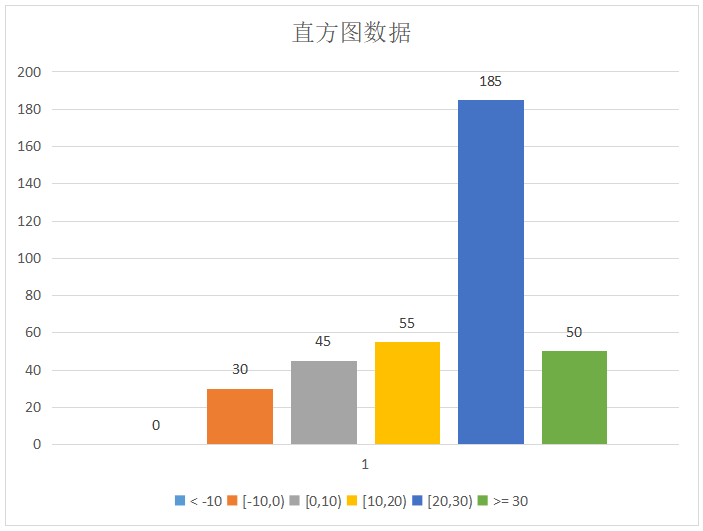
Uqbar=# select city, histogram(temperature, -10,30, 4) from weather group by city;
  city    |          histogram
------------+------------------------------
 chengdu  | {0,30,45,55,185,50}
 jinan   | {20,30,40,60,175,40}
 beijing  | {10,20,60,70,170,35}
(3 row)
The query will generate histogram data for the 'temperature' column with 6 buckets in the 'weather' table and group the results by 'city'. For example, the first row of the query output displays the histogram data for 'city = 'chengdu'' as follows:
By using the histogram function, you can perform distribution analysis on time-series data, identify outliers or data skewness, and gain deeper insights during the data analysis process.