SCA Result
The SCA result includes:
- Collection result: The data collection result in the source database (Oracle) will be automatically packaged into a ZIP file, and a clear file position prompt will be provided at the end of the collection.
- Analysis result: An analysis report is generated after the analysis is complete in the target MogDB/openGauss database. The report is stored in an independent folder, in the offline HTML format, and can be copied for reading at will.
Collection Result
The data collection result is automatically packaged into a ZIP file and stored in the current directory of the program by default.
The collection result prompts the following information:
2021-09-06 17:58:21 INFO [runMe.py:332] +==================== [ Summary Information ] ====================+
2021-09-06 17:58:21 INFO [runMe.py:333] | Task Name                                  File Name  File Size |
2021-09-06 17:58:21 INFO [runMe.py:334] | --------------------- ------------------------------ ---------- |
2021-09-06 17:58:21 INFO [runMe.py:336] | DB_PERFORMANCE                    db_performance.dat    3.82 MB |
2021-09-06 17:58:21 INFO [runMe.py:336] | DB_SESSION_SQL                    db_session_sql.dat    2.41 MB |
2021-09-06 17:58:21 INFO [runMe.py:336] | DB_SYNONYM                            db_synonym.dat    2.09 MB |
2021-09-06 17:58:21 INFO [runMe.py:336] | DB_SESSION_SQL_PERF   db_session_sql_performance.dat   31.54 KB |
2021-09-06 17:58:21 INFO [runMe.py:336] | DB_OBJECT                              db_object.dat   15.89 KB |
2021-09-06 17:58:21 INFO [runMe.py:336] | DB_CONSTRAINT                      db_constraint.dat    4.32 KB |
2021-09-06 17:58:21 INFO [runMe.py:336] | DB_USER                                  db_user.dat    3.55 KB |
2021-09-06 17:58:21 INFO [runMe.py:336] | DB_SEGMENT                            db_segment.dat    2.08 KB |
2021-09-06 17:58:21 INFO [runMe.py:336] | DB_NLS                                    db_nls.dat     580  B |
2021-09-06 17:58:21 INFO [runMe.py:336] | DB_SERVICE                            db_service.dat     303  B |
2021-09-06 17:58:21 INFO [runMe.py:336] | DB_CONFIG                              db_config.dat     292  B |
2021-09-06 17:58:21 INFO [runMe.py:336] | DB_IINFORMATION                   db_information.dat     284  B |
2021-09-06 17:58:21 INFO [runMe.py:336] | DB_SEQUENCE                          db_sequence.dat     251  B |
2021-09-06 17:58:21 INFO [runMe.py:336] | DB_VERSION                            db_version.dat     245  B |
2021-09-06 17:58:21 INFO [runMe.py:336] | DB_INSTANCE                          db_instance.dat     205  B |
2021-09-06 17:58:21 INFO [runMe.py:336] | DB_LINK                                  db_link.dat     128  B |
2021-09-06 17:58:21 INFO [runMe.py:336] | DB_CONTAINER                        db_container.dat  not found |
2021-09-06 17:58:21 INFO [runMe.py:336] | DB_TABLE_MODIFICATION      db_table_modification.dat       0  B |
2021-09-06 17:58:21 INFO [runMe.py:336] | DB_JOB                                    db_job.dat       0  B |
2021-09-06 17:58:21 INFO [runMe.py:336] | DB_SCHEDULER                        db_scheduler.dat       0  B |
2021-09-06 17:58:21 INFO [runMe.py:337] +=================================================================+

 >>> Final Result is:
 >>> ----------------------------------------------
 >>> data_20210906175728.zip
Analysis Report
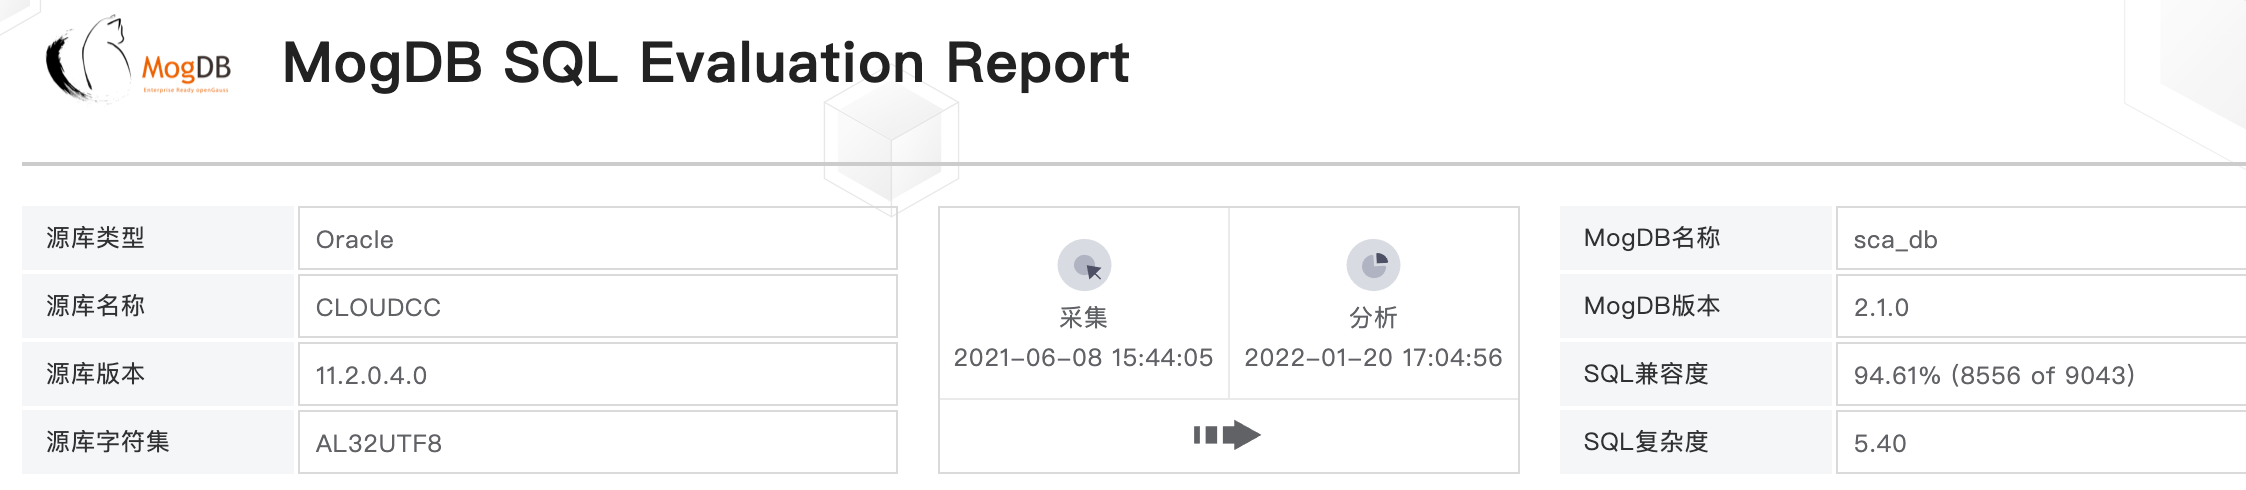
Both compatibility analysis and SQL performance simulation will generate an analysis report, which are stored in specified data directories by default. You can also use -r to specify the output directory of the report.
Report Entry
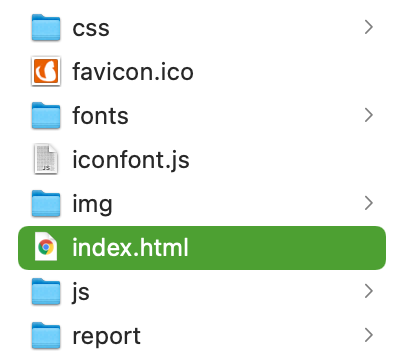
In the analysis report directory, you can click index.html to view the analysis report through the default browser Google Chrome.
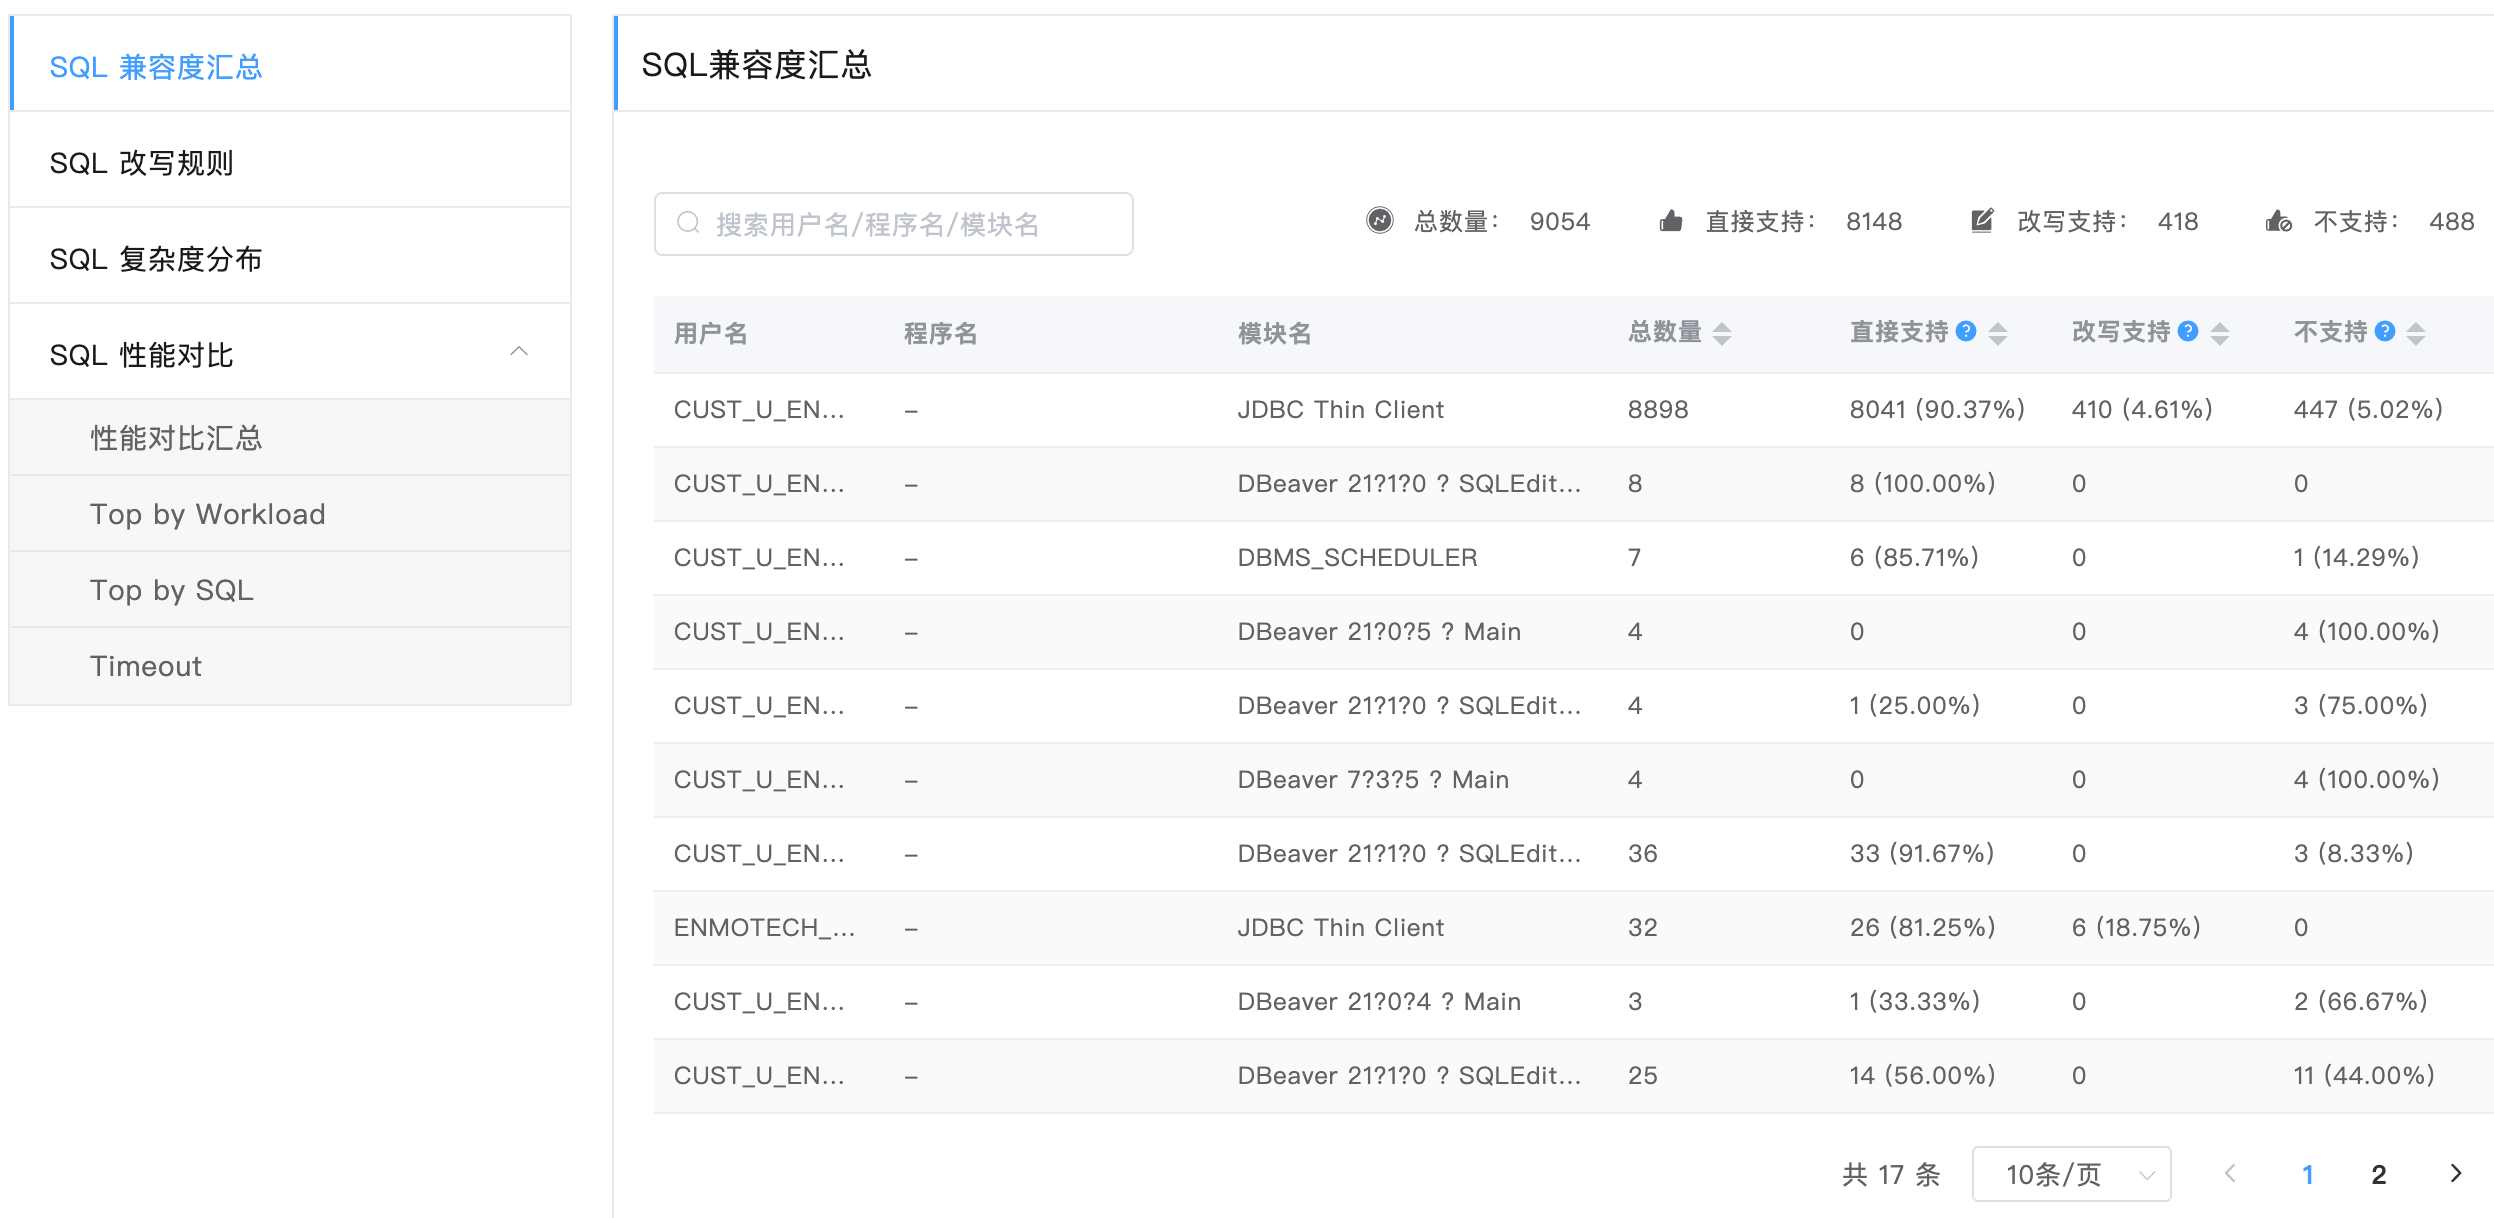
SQL Compatibility Summary
The SQL compatibility summary page shows the compatibility analysis result. The table lists all SQLs collected from the system and whether they are supported in MogDB by user name, program name, and module name.
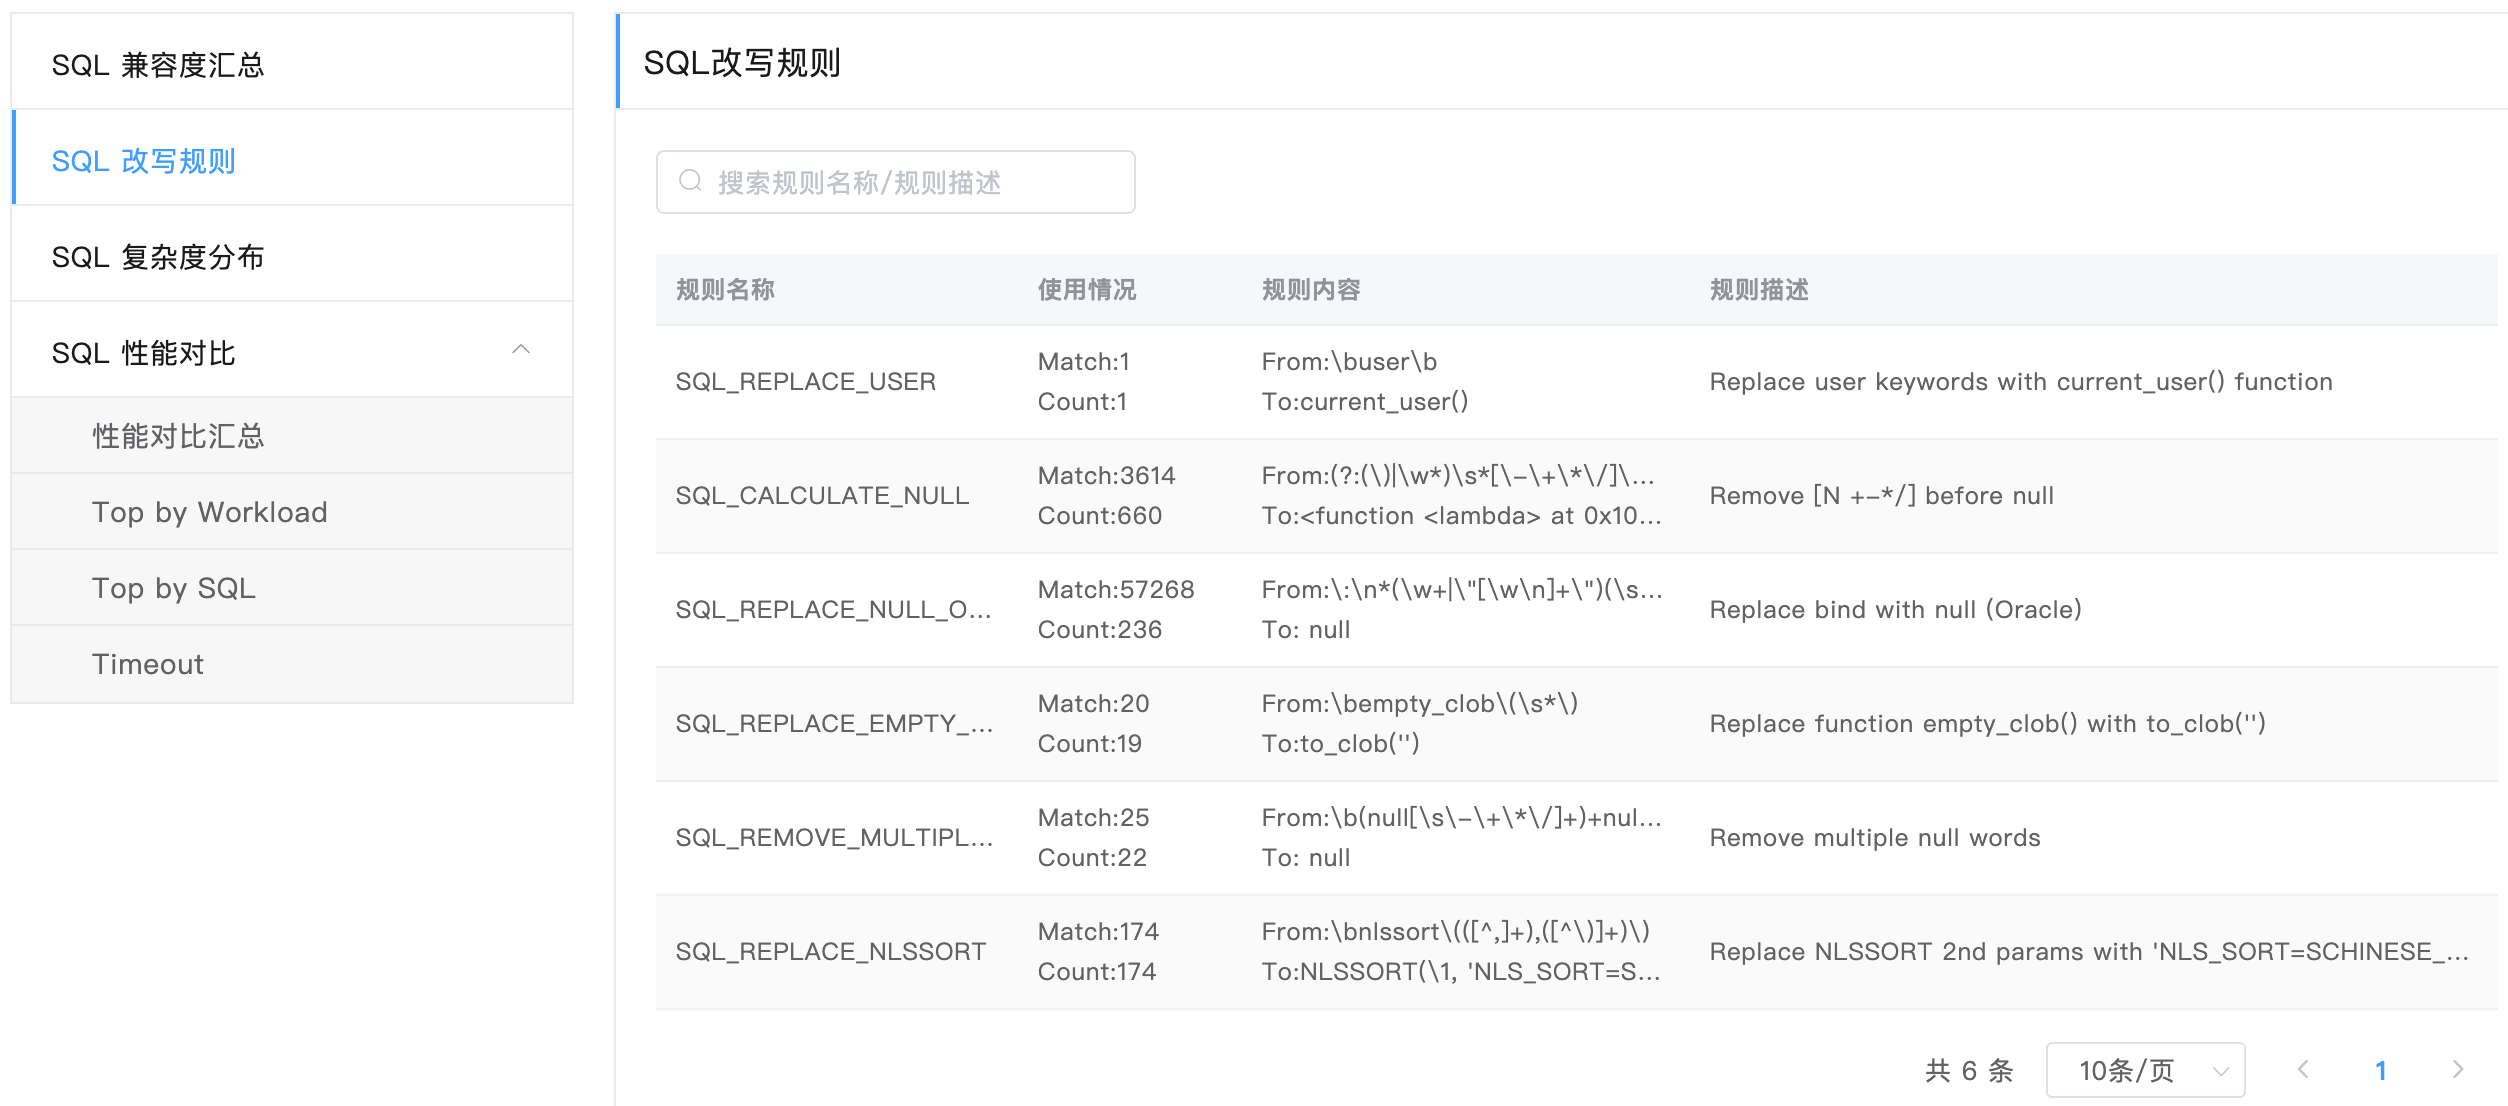
SQL Rewrite Rule
The SQL rewrite rule page shows the SQL rewrite rules involved in the analysis.
The usage field shows the trigger situation of a rule.
- Match indicates the number of rule hits in a SQL.
- Count indicates the number of SQLs that match a rule.
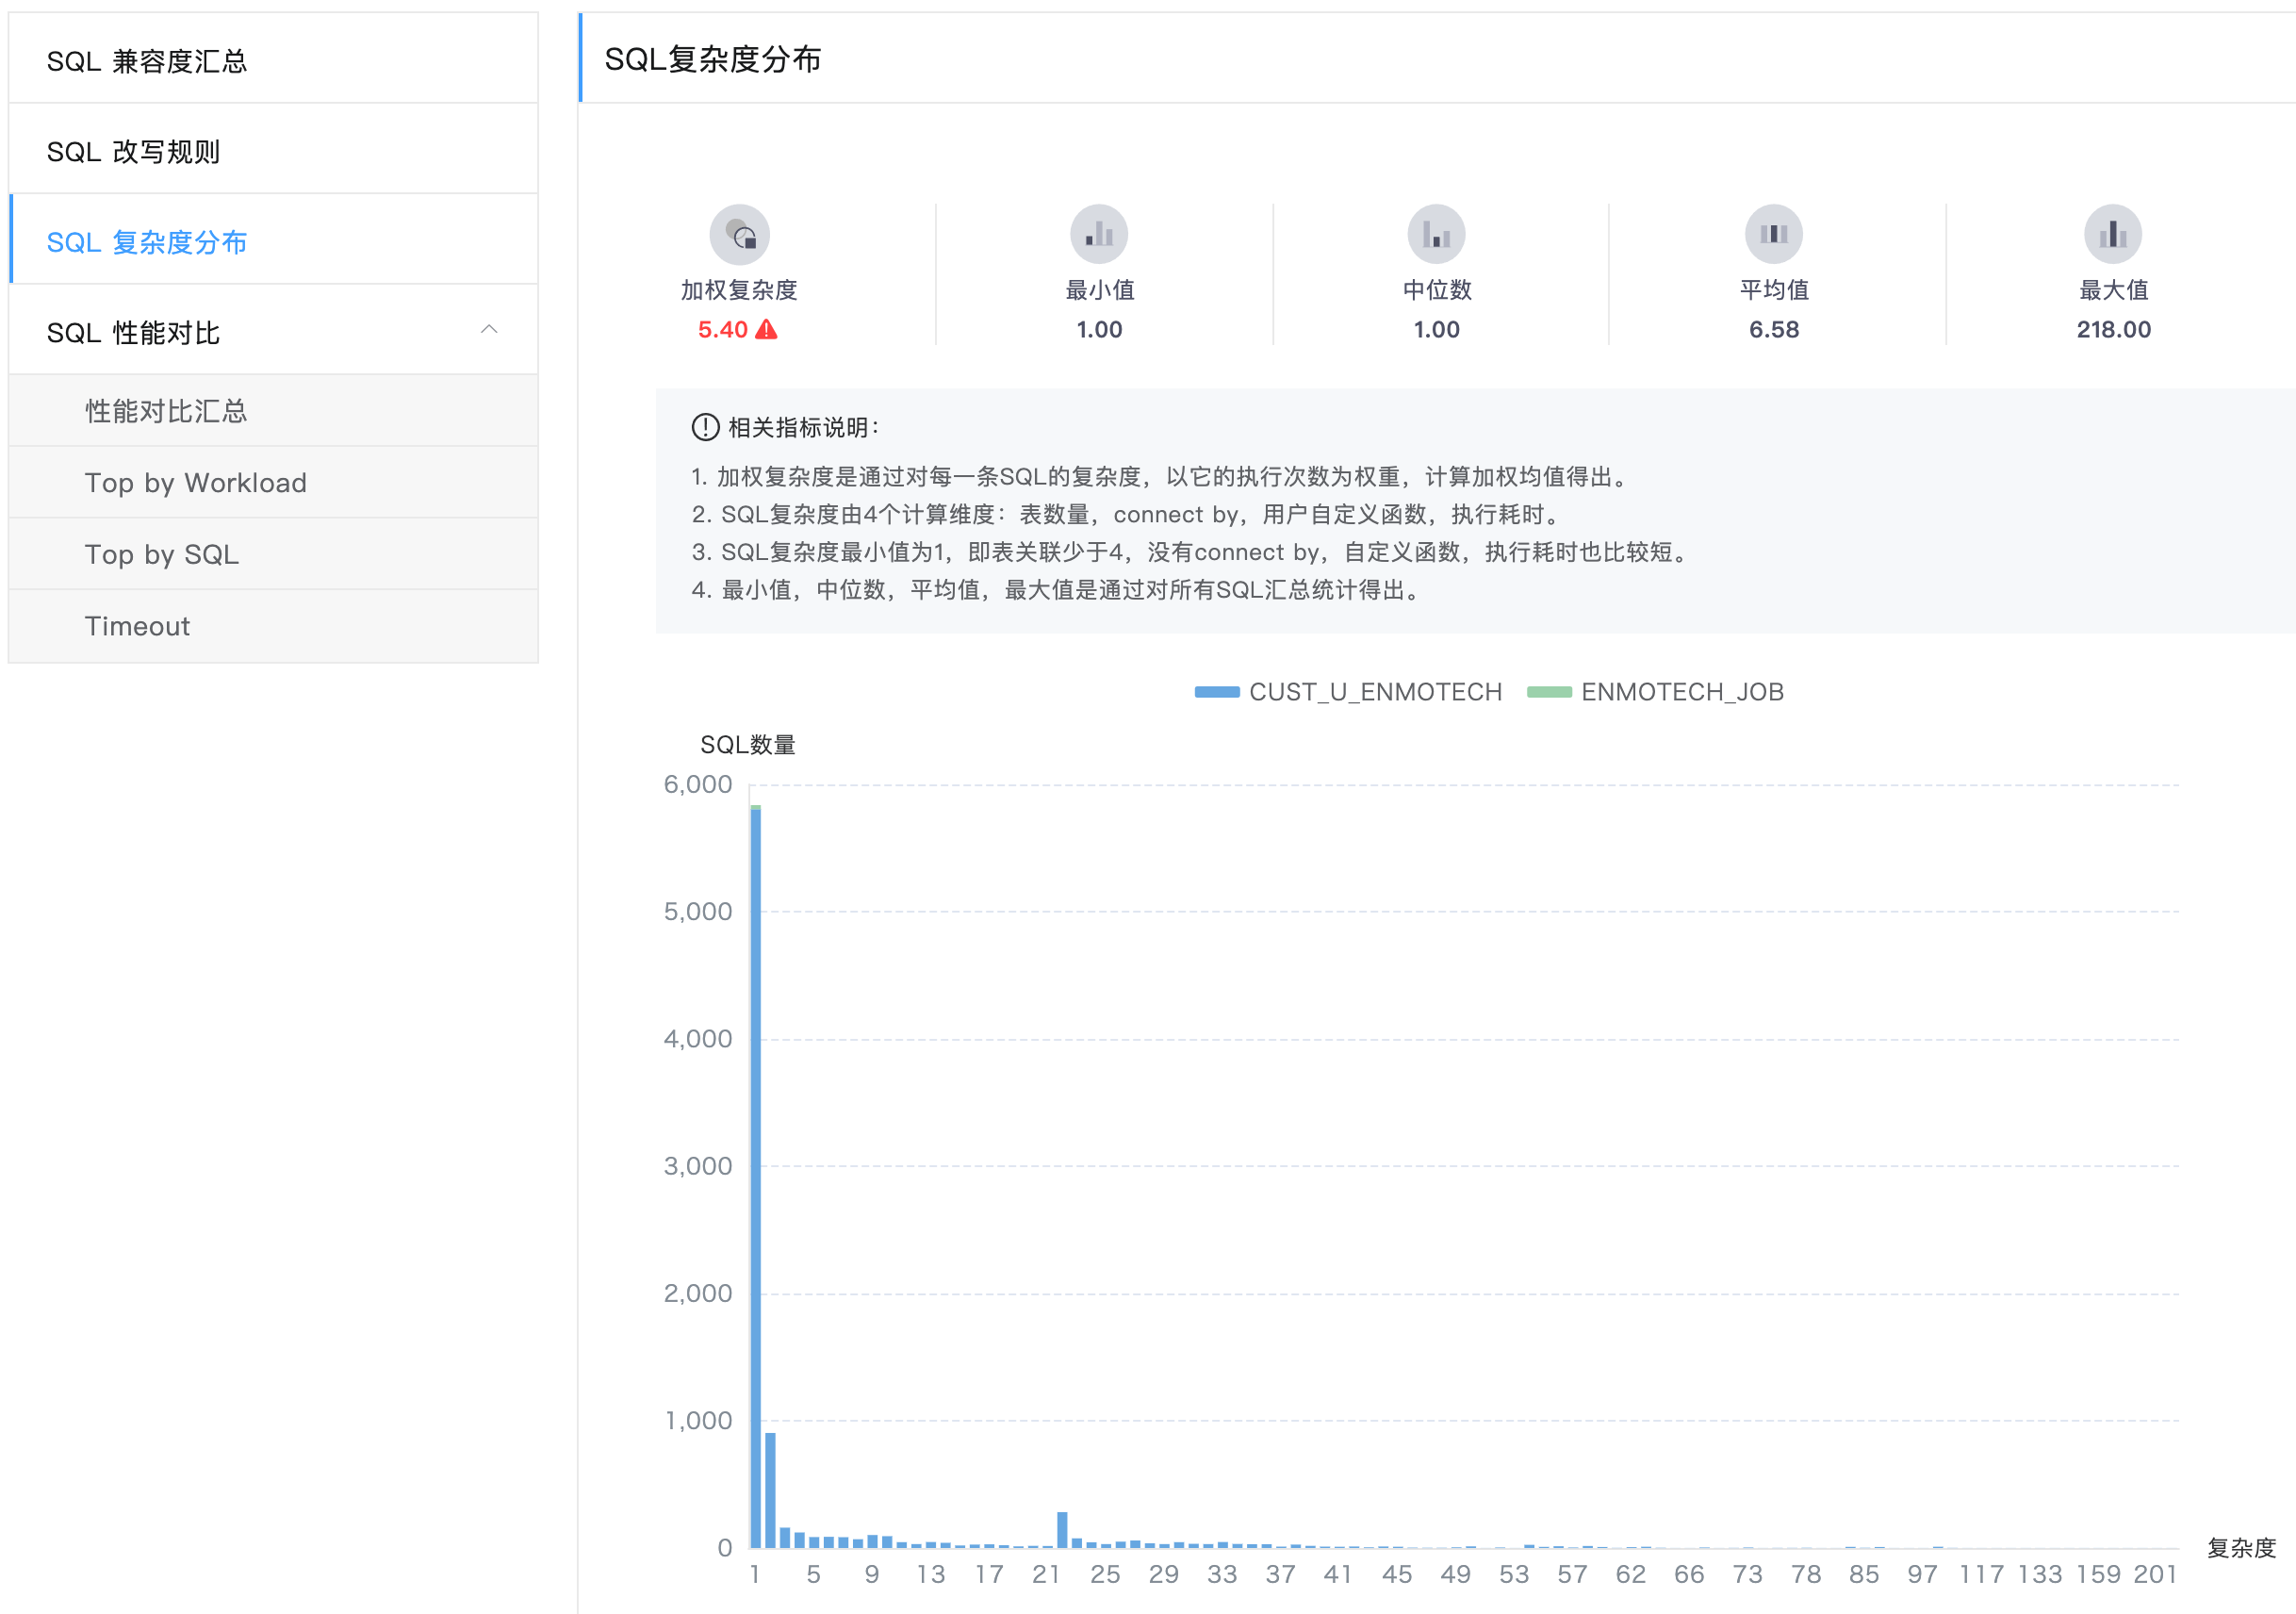
SQL Complexity Distribution
The SQL complexity distribution page shows the SQL complexity distribution. The current judgment standard of complexity distribution is as follows:
- The more the number of tables that a SQL involves, the higher the complexity.
- The more the number of times for using the connect by syntax in a SQL, the higher the complexity. In this situation, the execution performance problem occurs probably.
- The more the number of user-defined functions used in a SQL, the higher the complexity. Because the logic complexity in a user-defined function is not clear, the SQL complexity is high if many user-defined functions are used in a SQL.
- The longer the time taken for executing a function in Oracle, the higher the SQL complexity.
The complexity of each SQL is determined according to the above four standards. If the SQL complexity is higher, the SQL execution performance needs to be paid more attention to after migration. Only in this way can service faults be avoided due to performance problems.
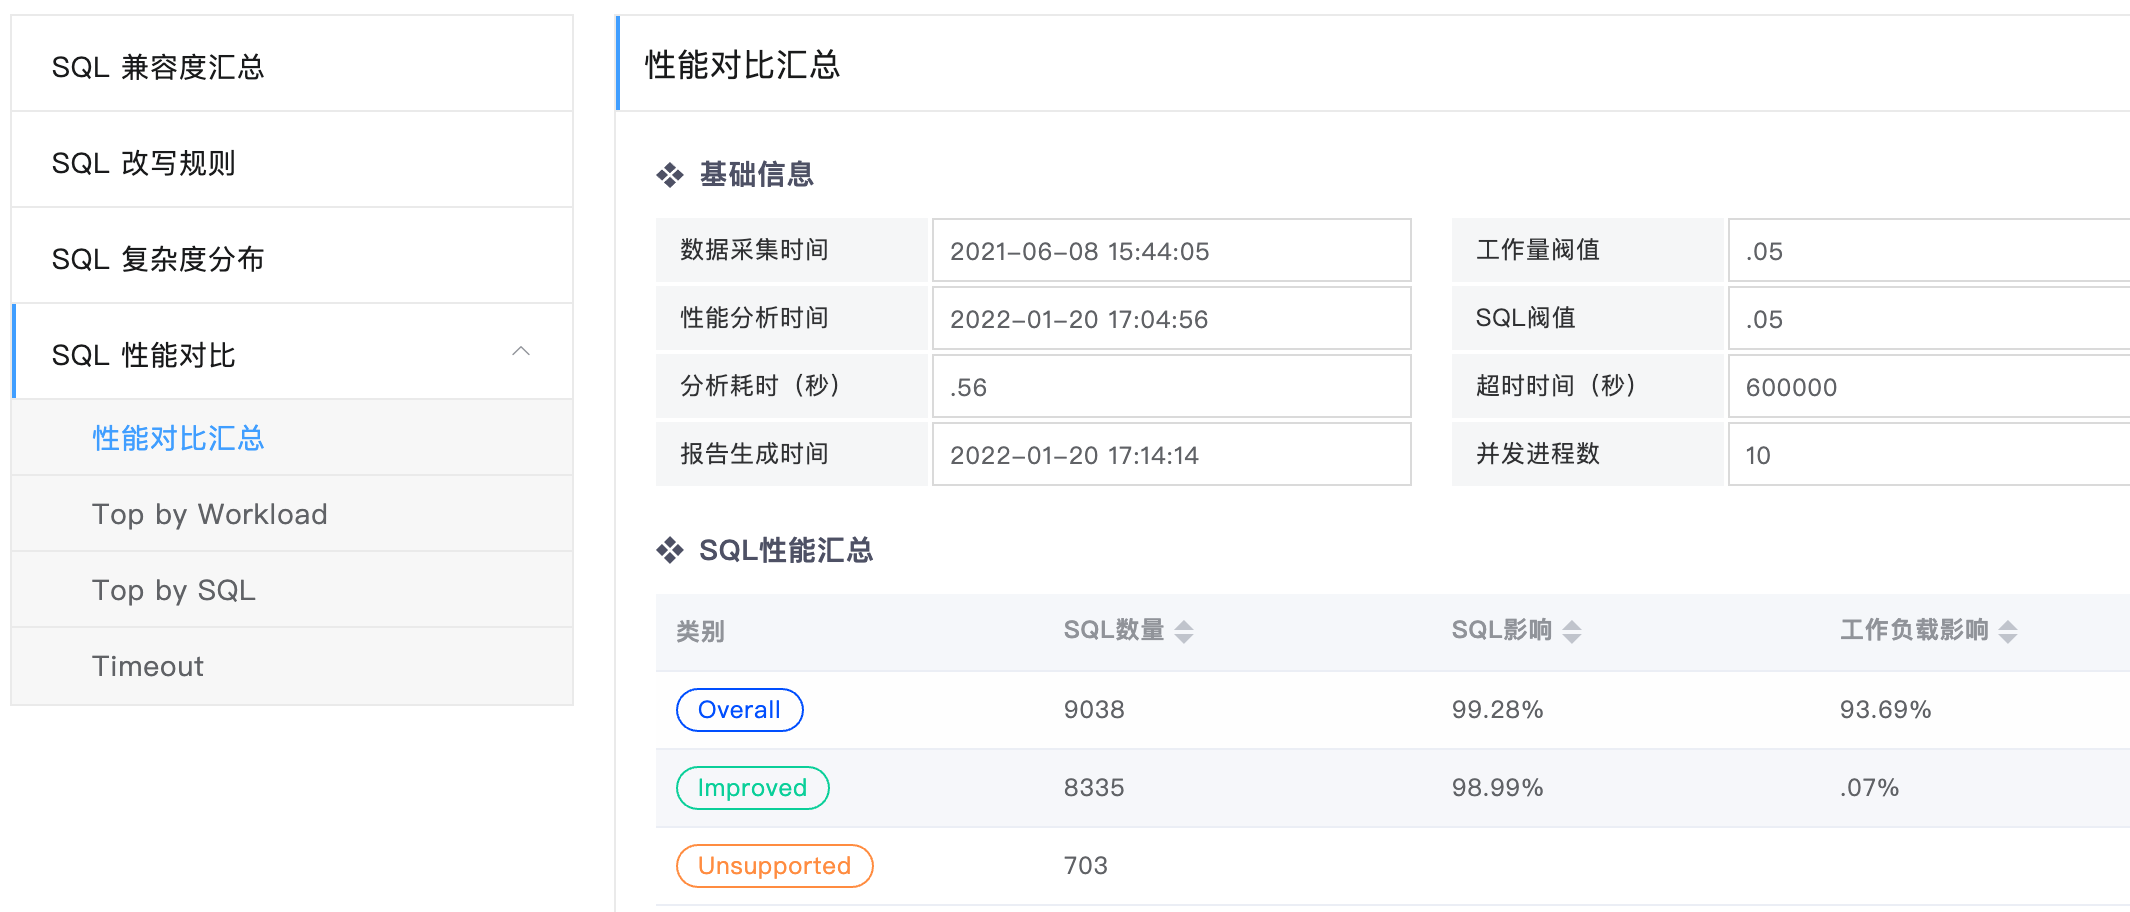
SQL Performance Comparison (Performance Comparison Summary)
The SQL performance comparison summary page shows the following information:
- Basic performance comparison information, basic configuration related to performance comparison, and related thresholds used in comparison
- SQL performance is summarized by such dimensions as general, up, down, not supported, and timeout to analyze the impact of all kinds of SQLs on the overall workload.
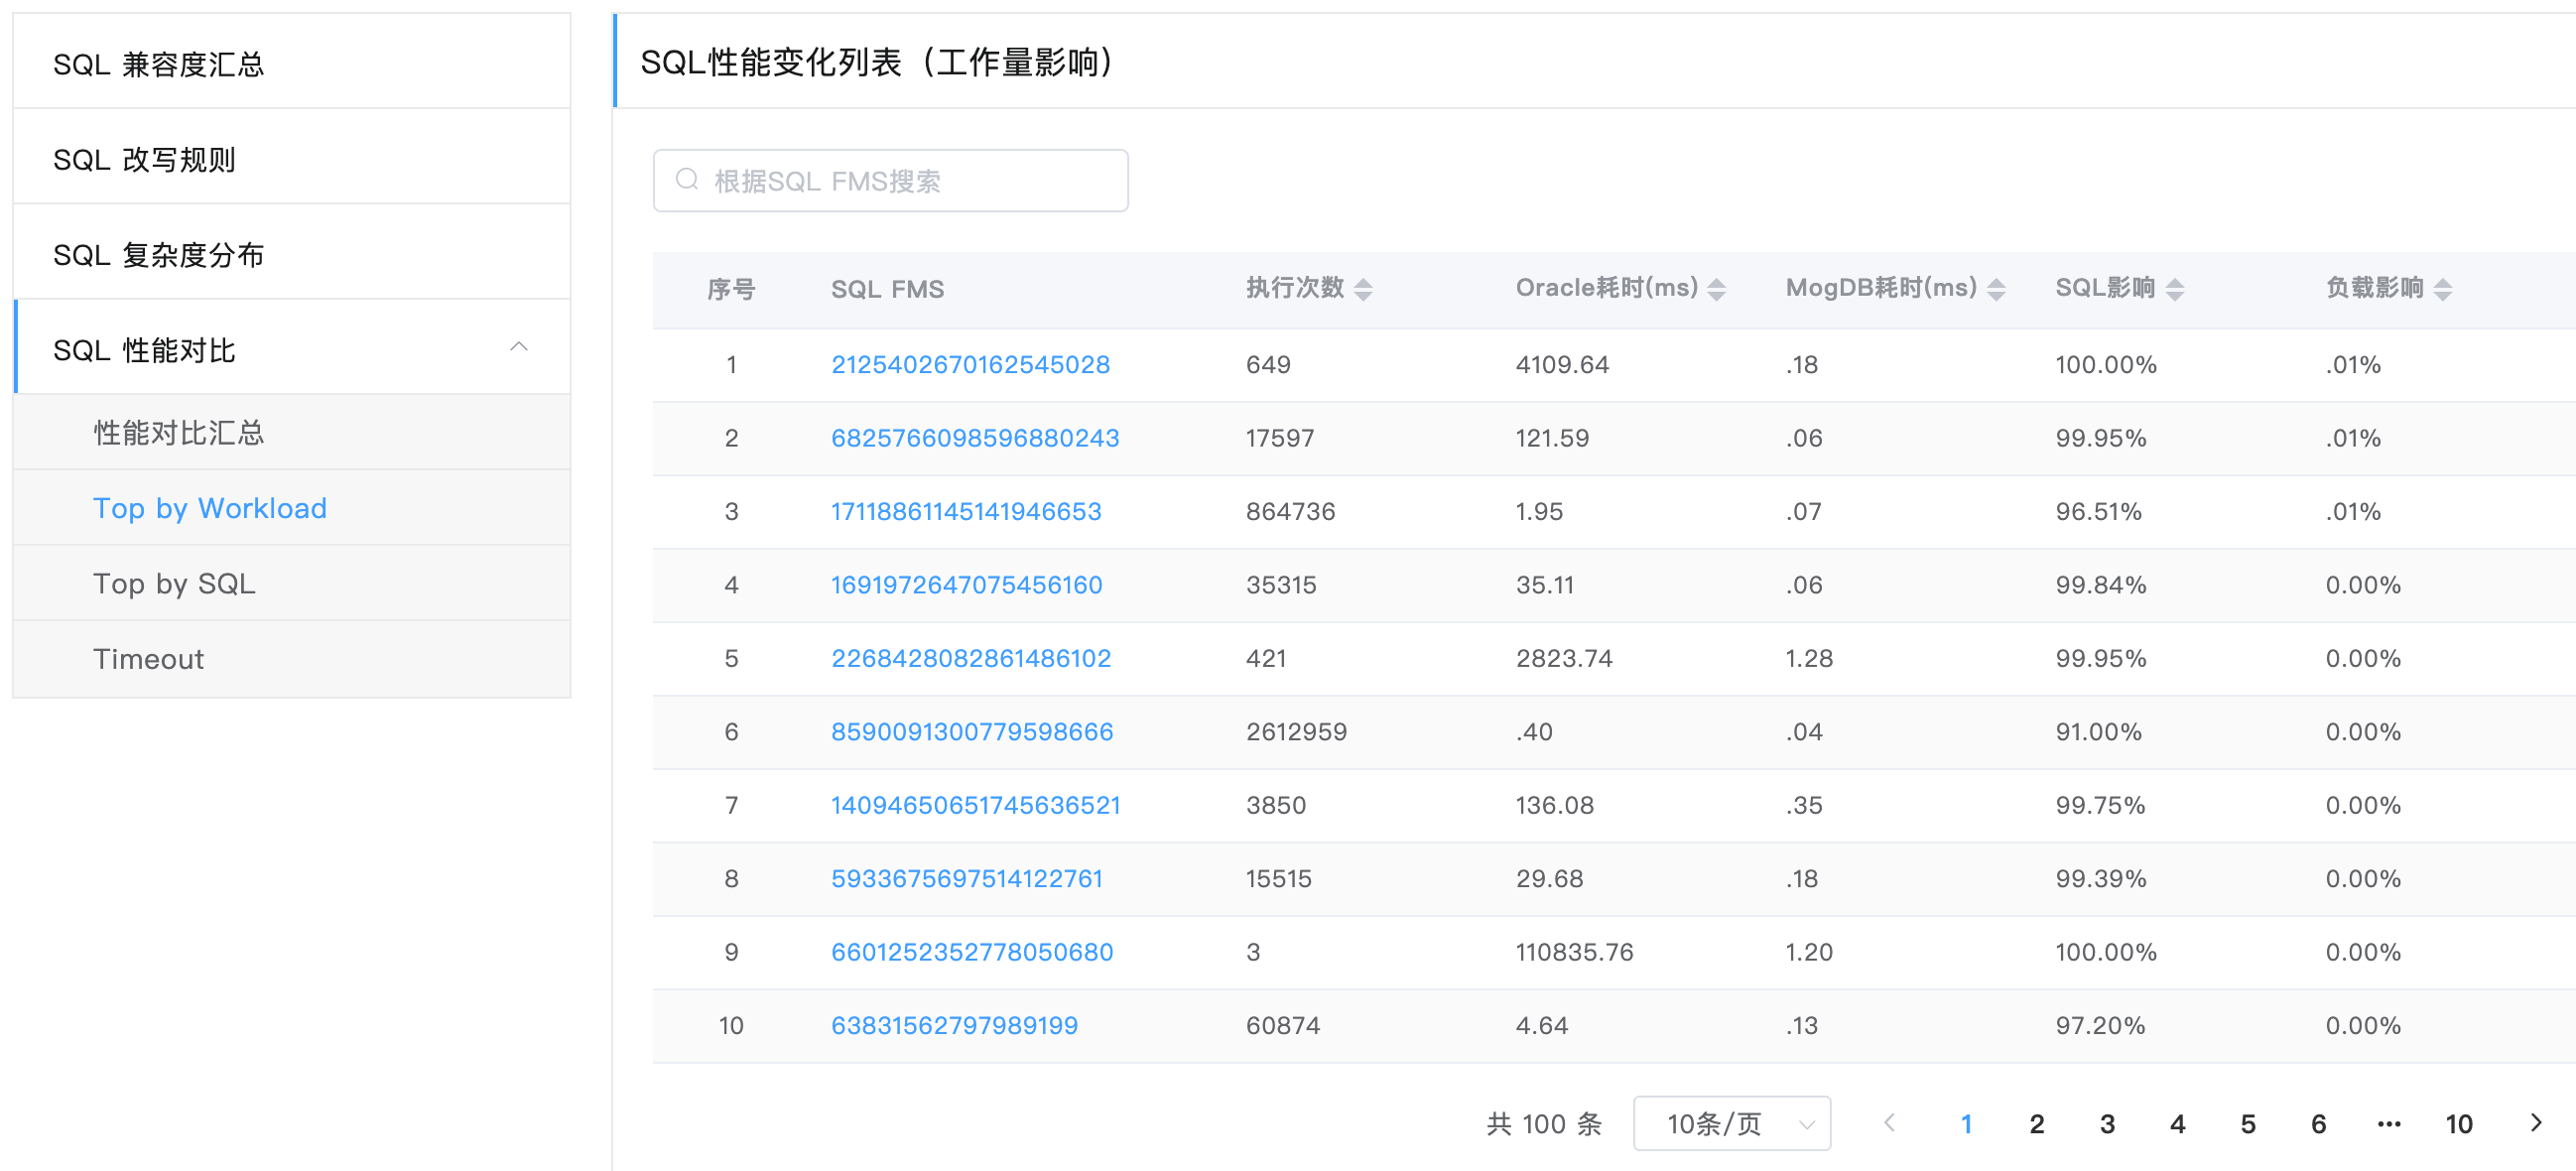
SQL Performance Comparison (Top by Workload/SQL, Timeout)
In SQL performance comparison, the content formats of the Top by Workload, Top by SQL, and Timeout pages are similar. The following uses the Top by Workload page as an example. The table lists 100 SQLs that affect the performance most. The SQL FMS field uses the hyperlink format, which can be clicked to view the SQL analysis details. The SQL performance impact can be assessed from two dimensions:
- SQL impact: the proportion of SQLs that has performance impact when single SQL is executed
- Load impact: the impact of the current SQL on the performance change of the overall SQL workload and the overall SQL performance in terms of the total number of its execution times.
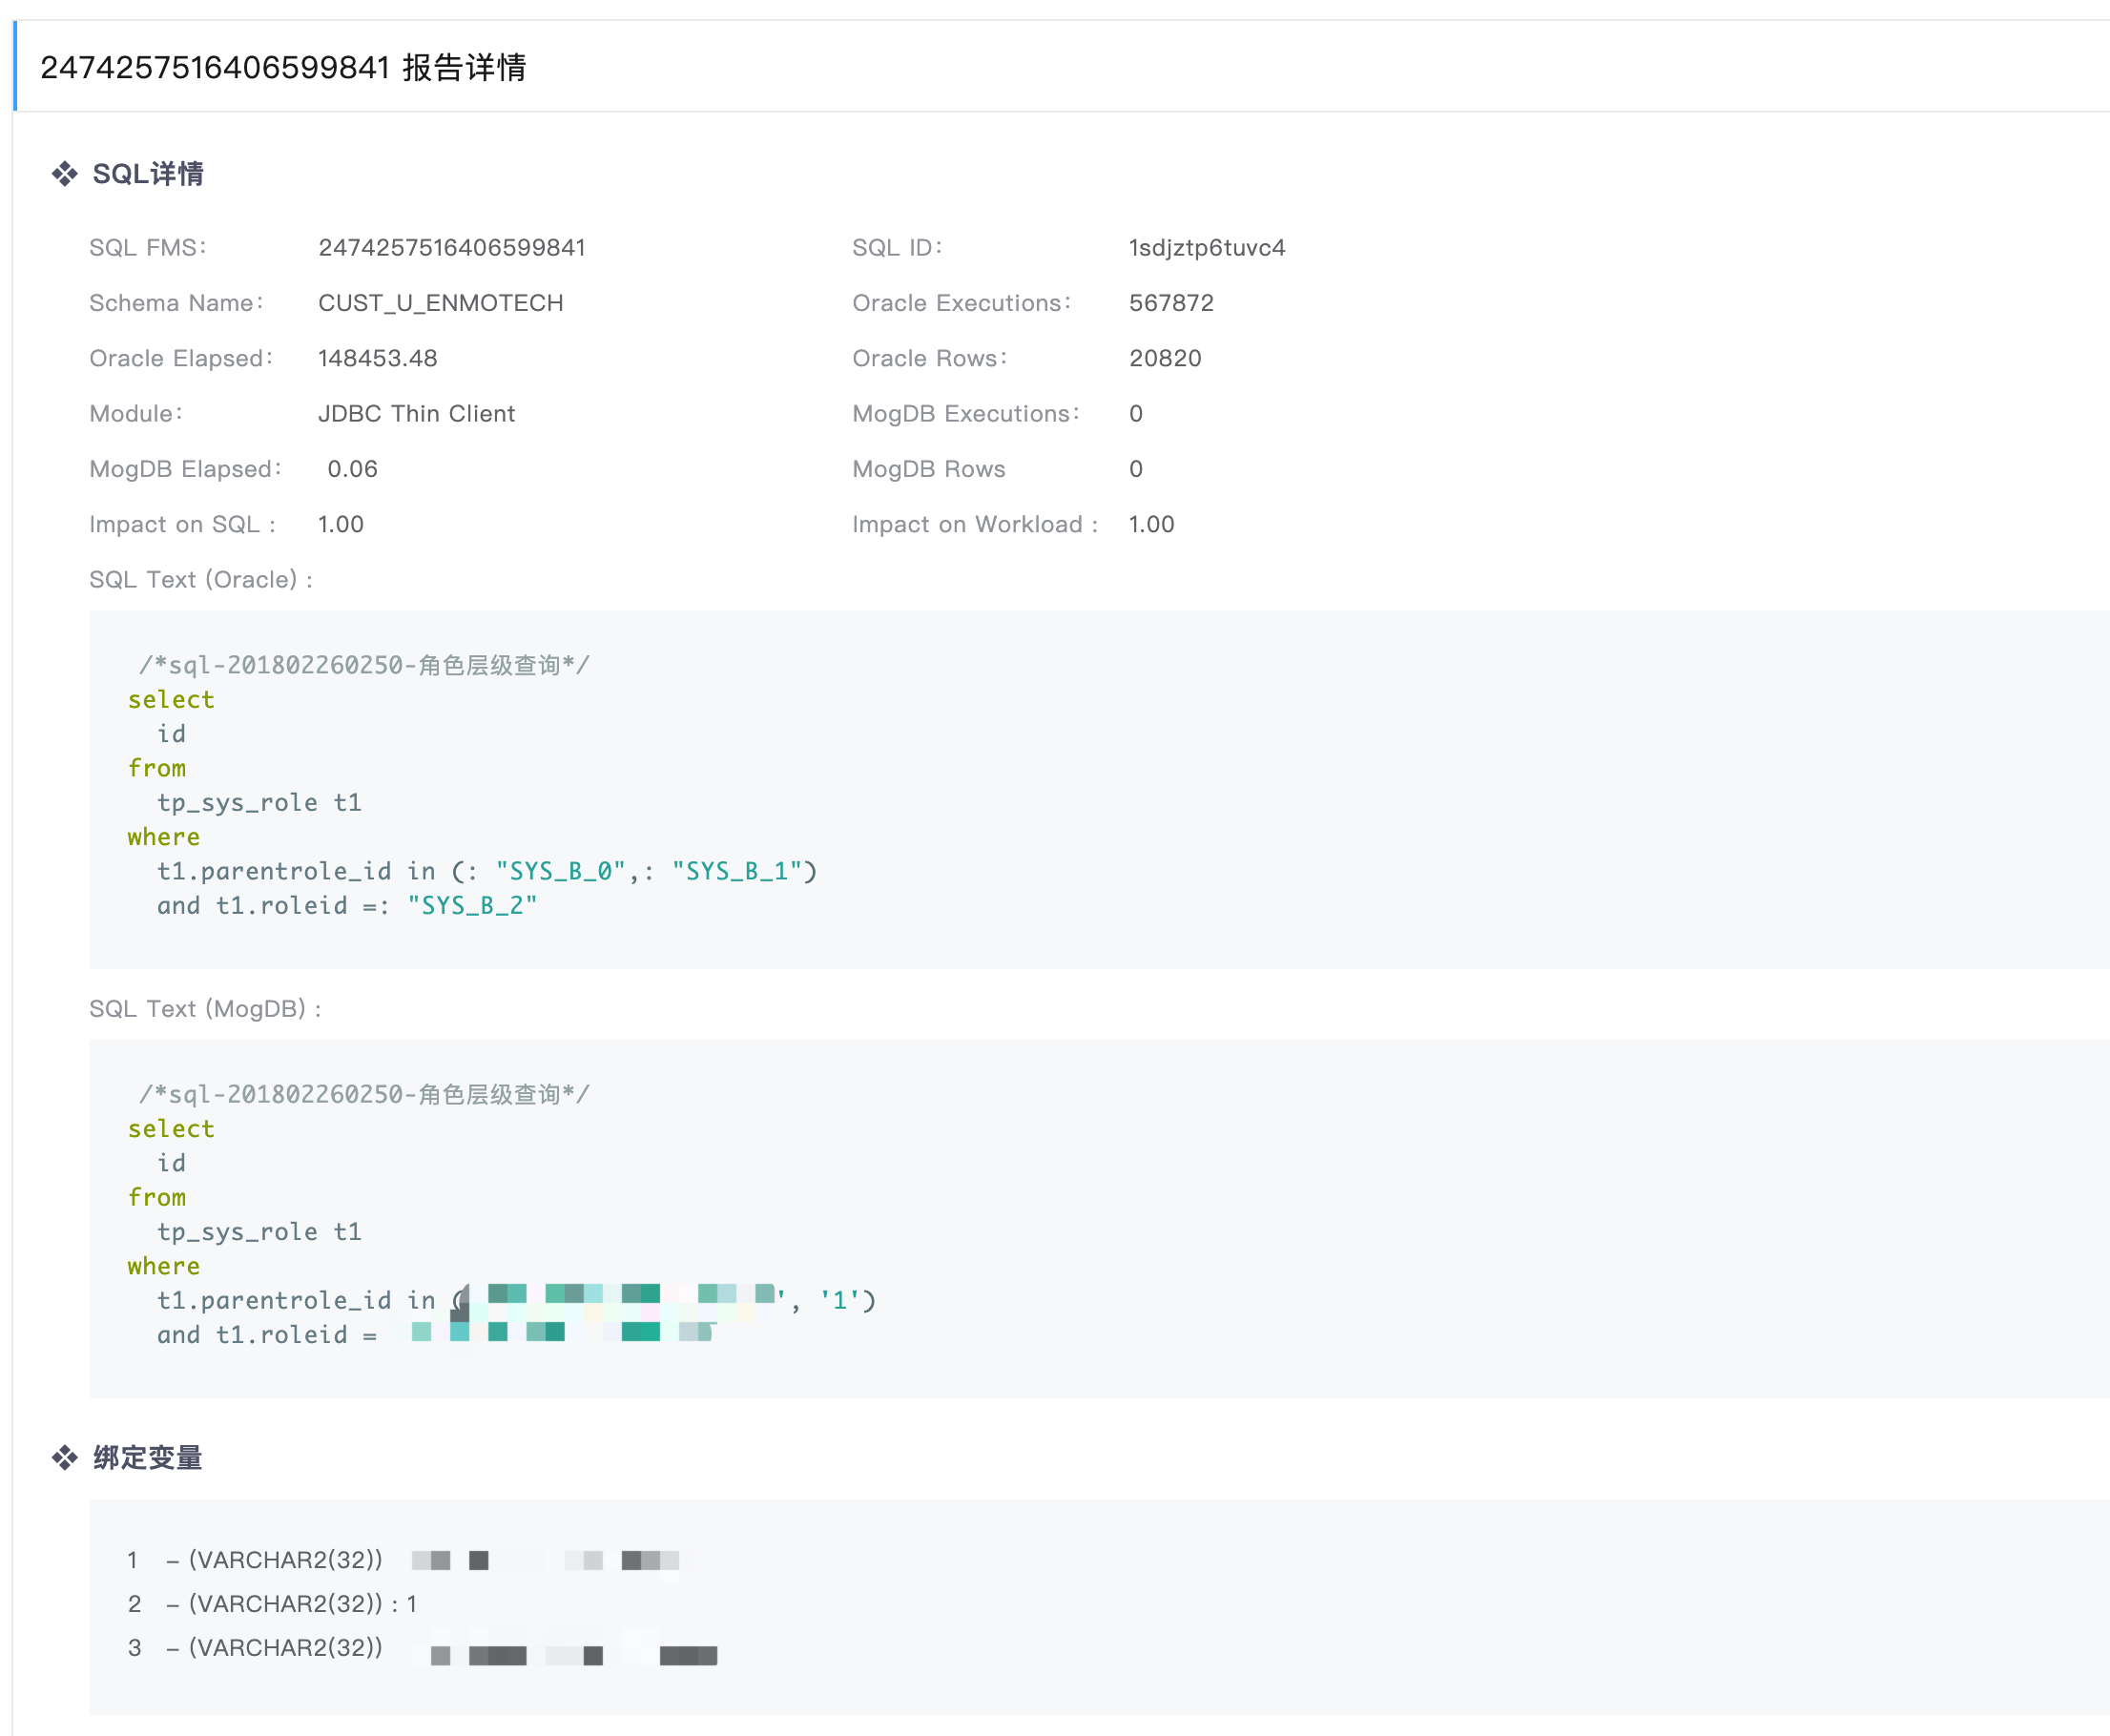
SQL Performance Comparison (SQL Details)
The SQL details page shows the following information:
-
SQL execution information: SQL execution information in Oracle and MogDB
Oracle execution information is from the dynamic performance view, and MogDB execution information is from actual SQL execution.
-
SQL text: SQL execution text in Oracle and actual execution text in MogDB
-
SQL binding variable: SQL binding variable in Oracle
The binding variable will be applied to the SQL execution text in MogDB to simulate service execution in MogDB.
-
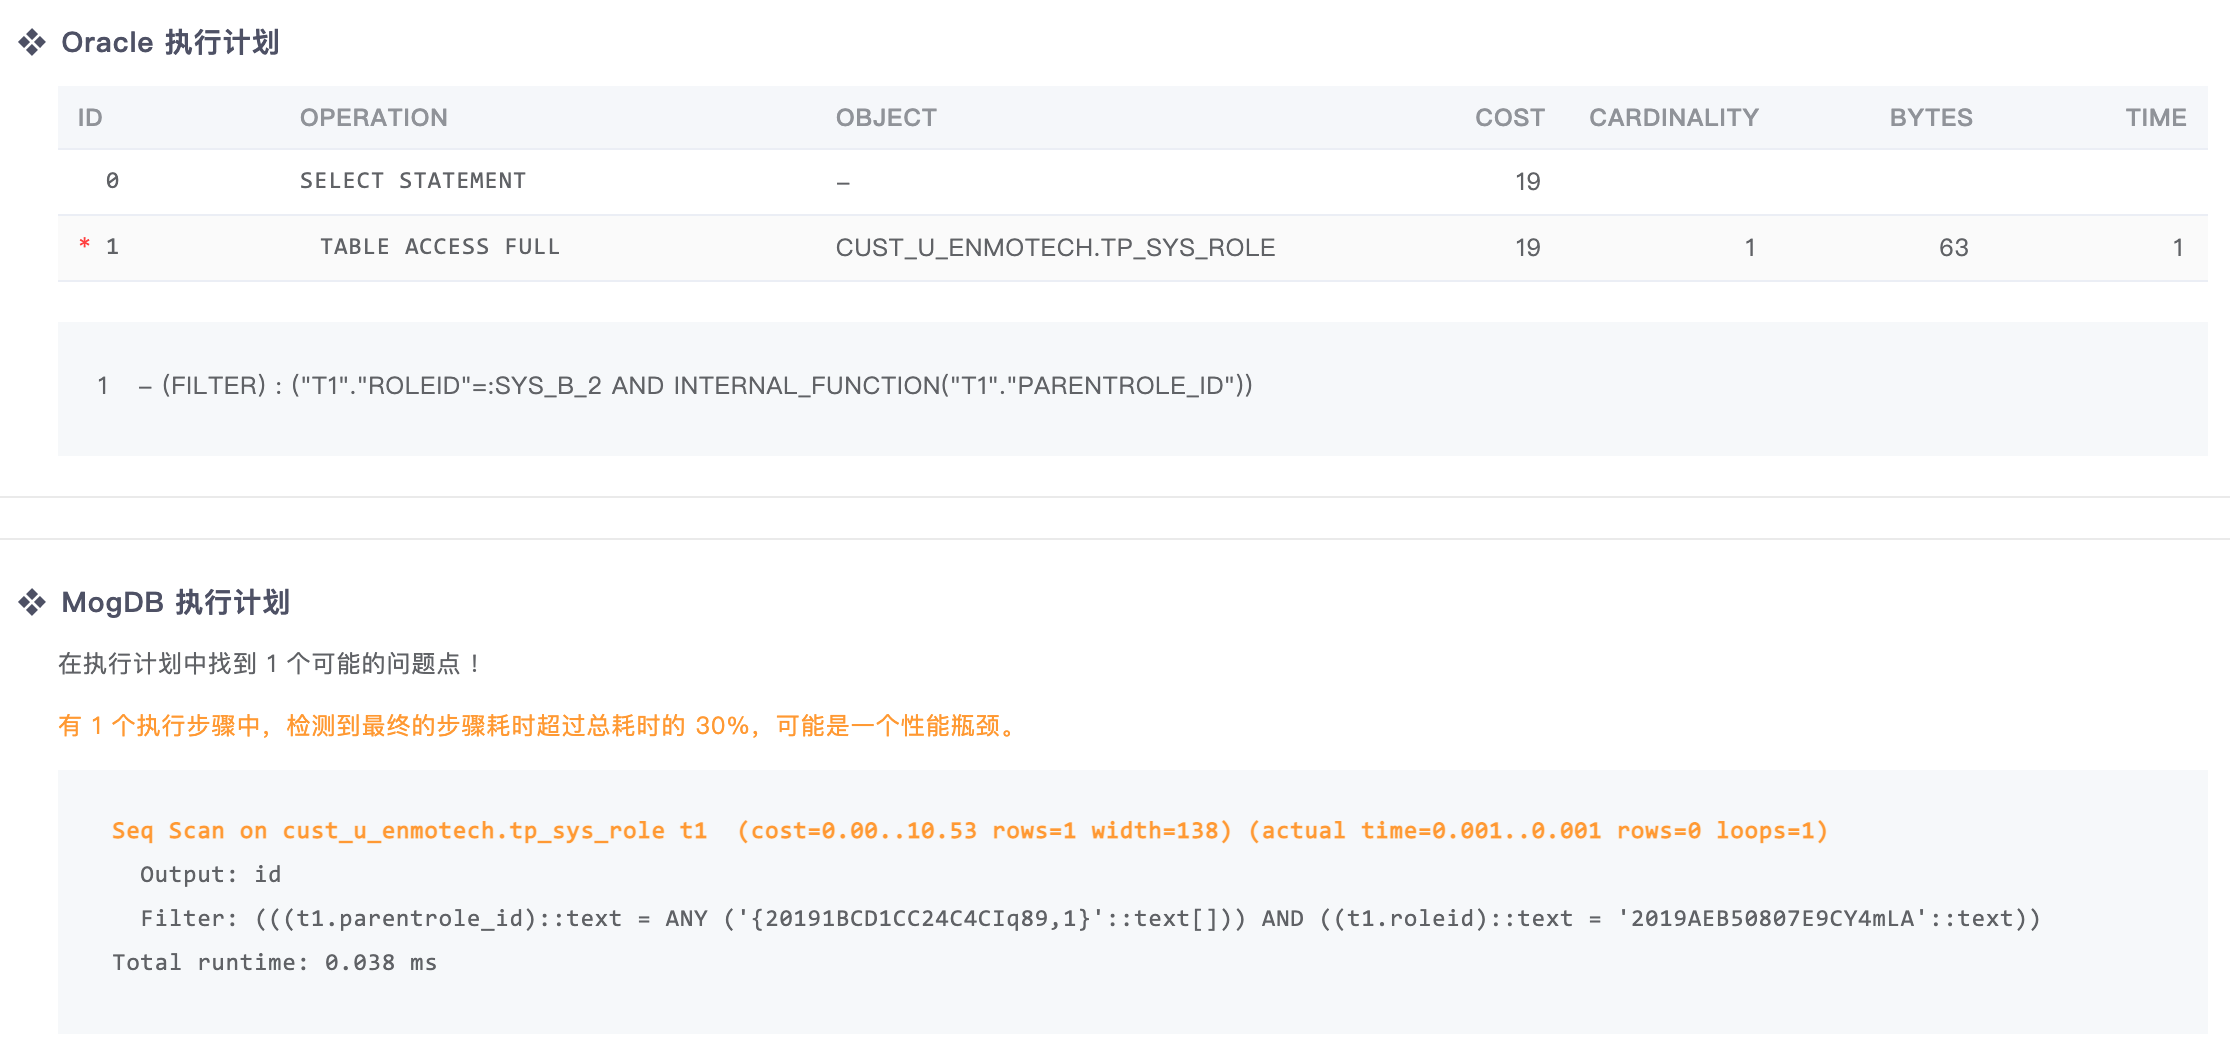
Oracle execution plan: SQL execution plan in Oracle, which is from the dynamic performance view
-
MogDB execution plan: SQL execution plan in MogDB, which is from actual execution.
The program automatically analyzes the MogDB execution plan and marks out the potential performance problems.
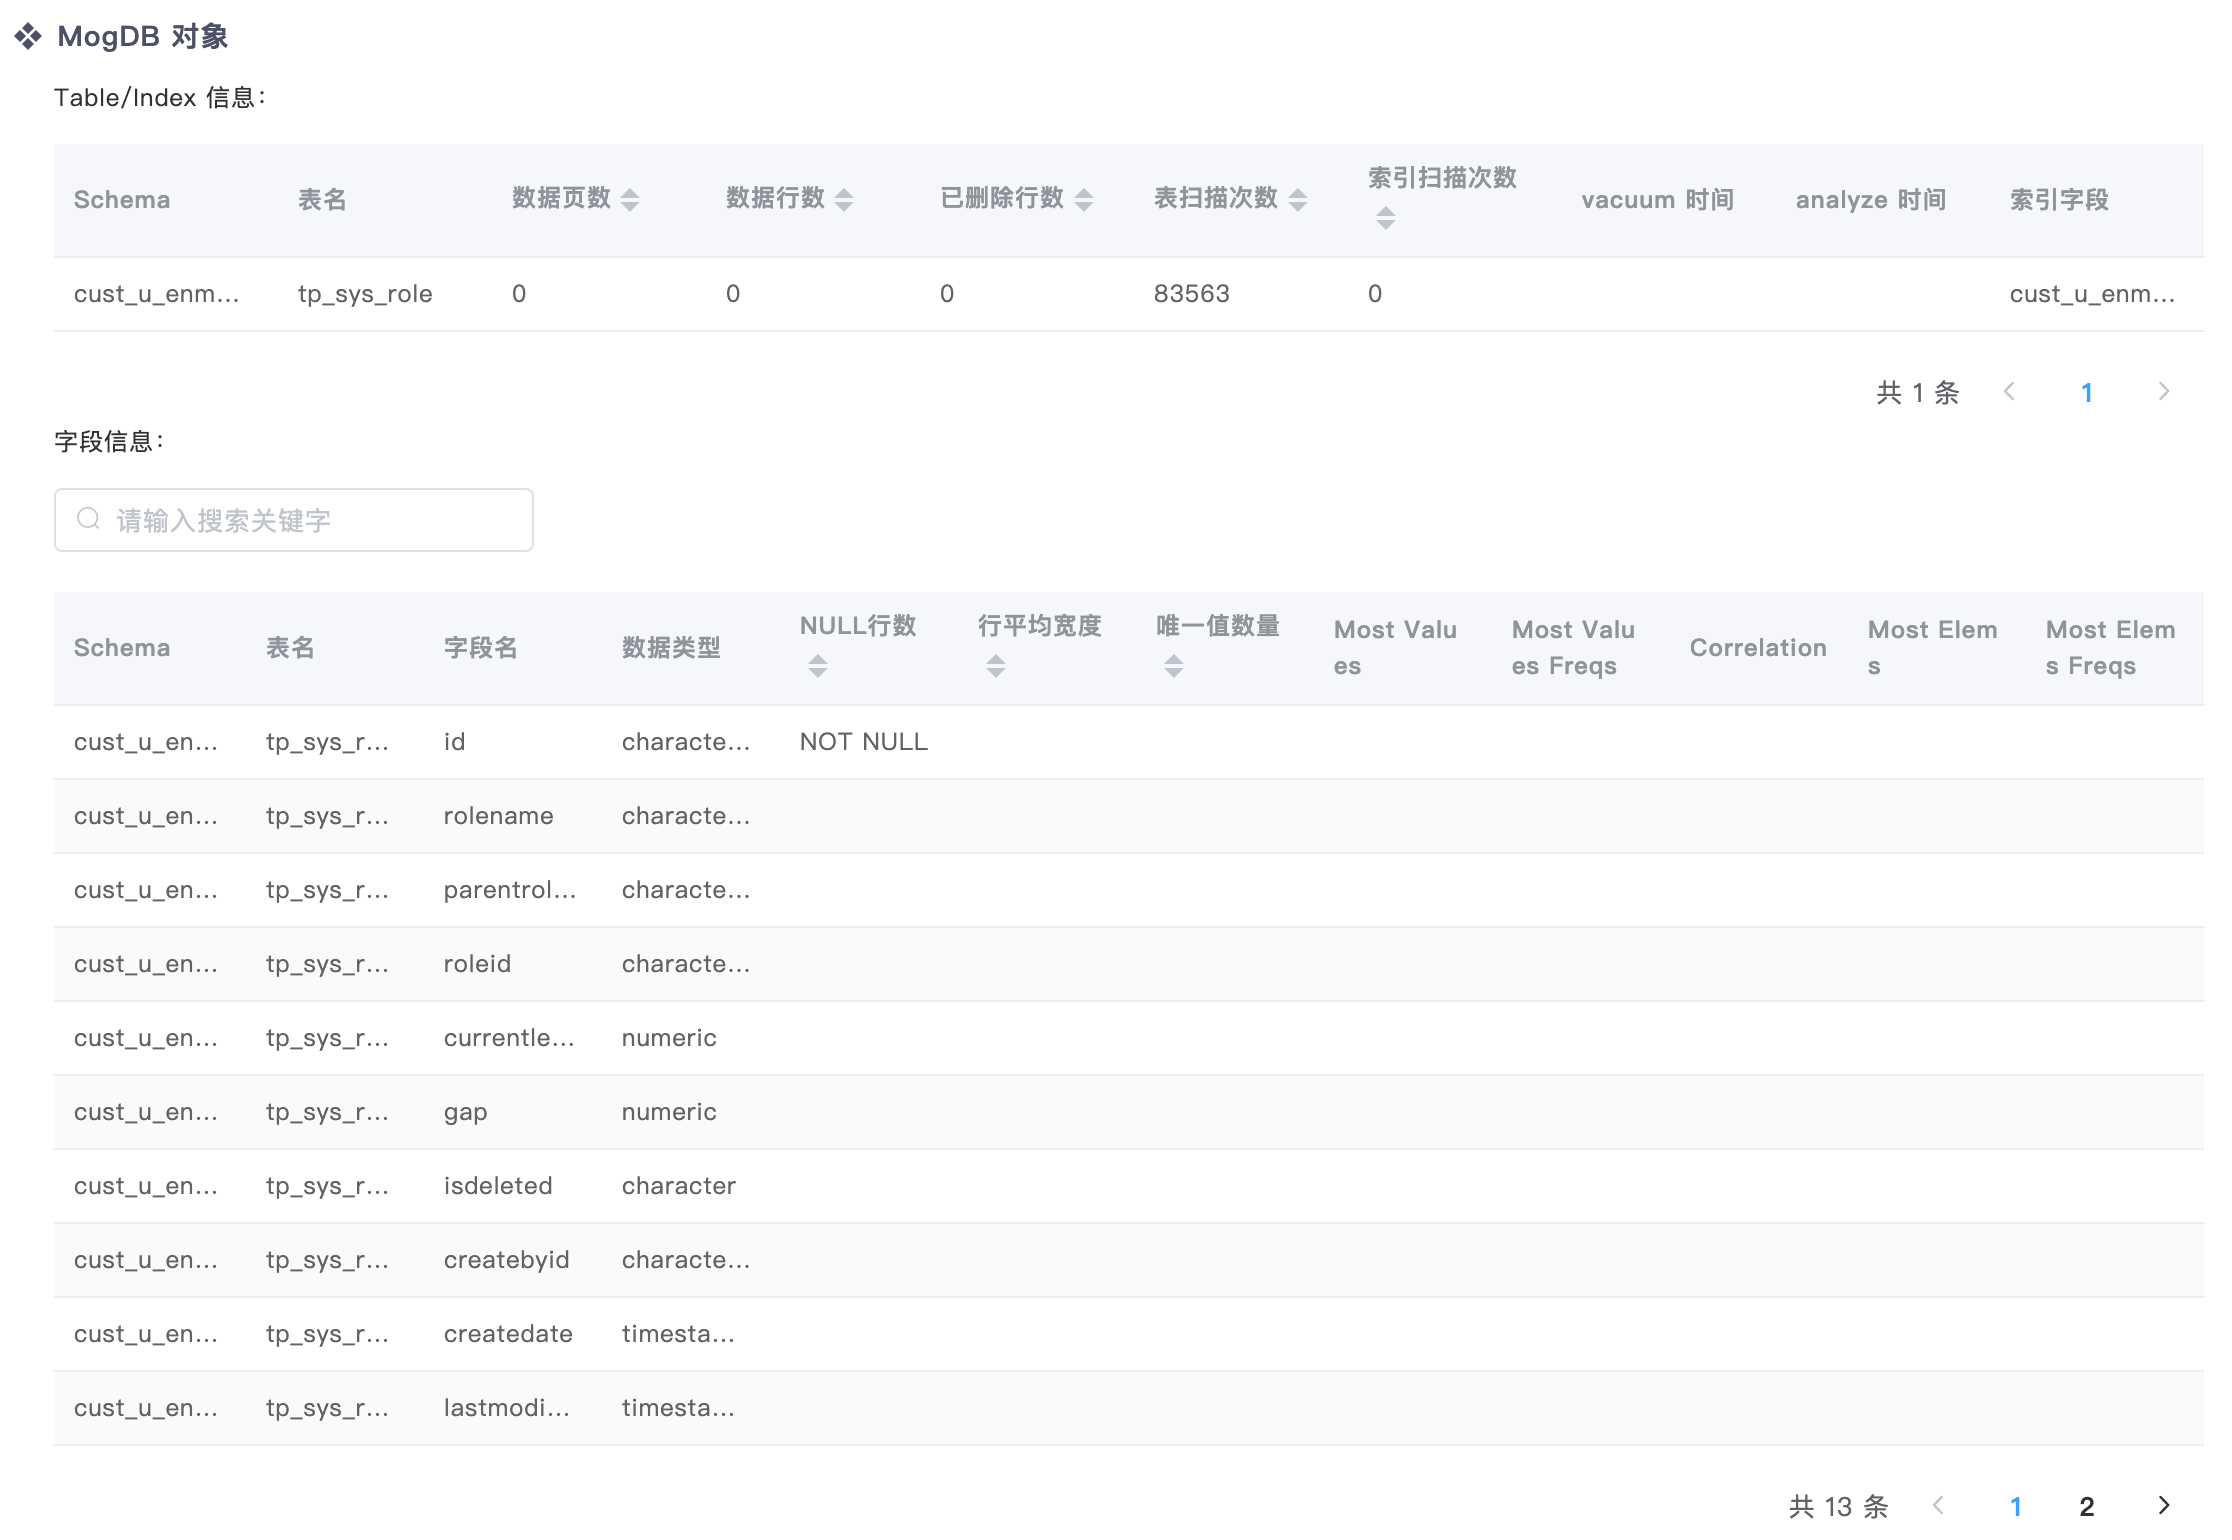
-
MogDB object information: structures and statistics of SQL-involved objects in MogDB
Supported SQL List
In the root directory where the report is located, the sql_detail_list.csv file records all supported SQLs involved in the SQL compatibility evaluation, automatic rewriting policies of partial SQLs during the evaluation, and rewritten SQL script.
The file contains the following fields (MySQL):
- schema_name: specifies the schema of SQLs to be executed. In Oracle, this field refers to the user. In MySQL, this field refers to the database.
- sql_type: specifies the SQL type. You need to make it clear whether the SQLs collected from MySQL are system SQLs or service SQLs.
- user_host: specifies the host information of the MySQL client user who executes SQLs and the corresponding execution client.
- mysql_error: specifies the SQL execution situation in MySQL. If the execution result is 0, the SQL execution is successful. Otherwise, the execution error is reported.
- mogdb_error: specifies the SQL execution error code in MogDB.
- mogdb_error_message: specifies the SQL execution error message in MogDB.
- sql_text: specifies the original SQL script.
- transform_matched: specifies the automatic rewriting rules of SQLs.
- sql_rewrite: specifies the rewritten SQL script.